- English
- عربي
S&P 500 Outlook: Bulls in control as the 200-day moving average in sight


S&P 500 outlook for the week ahead - 12 May 2025
The Trading Bias for the Week Ahead
While acknowledging that the S&P500 has rallied 19.4% from the 7 April lows and has priced in quite a lot of good news, the pain trade and price momentum remains skewed towards higher levels. Subsequently, unless the US core CPI release (due on Tuesday) comes above 3% y/y, or we see a big decline in the US retail sales report (due Thursday), pullbacks in the S&P500 should be well supported.
It's worth noting that US corporate equity buybacks resume this week after the recent blackout period and should build as the week progresses – equity buybacks typically reduce equity volatility and historically correlate strongly with equity returns. Adding to the flow-based effects that could support the S&P500, systematic funds (CTAs) will also be better buyers of SPX and NAS100 futures with price pushing above trigger levels, while the reduction in S&P500 realised volatility will likely see the volatility-targeting/risk parity funds increasing their leverage and equity exposures.
Read the week ahead: Markets React to US-China Progress & CPI Data
The S&P500 Trader Playbook
Gauging a Potential Trading Range
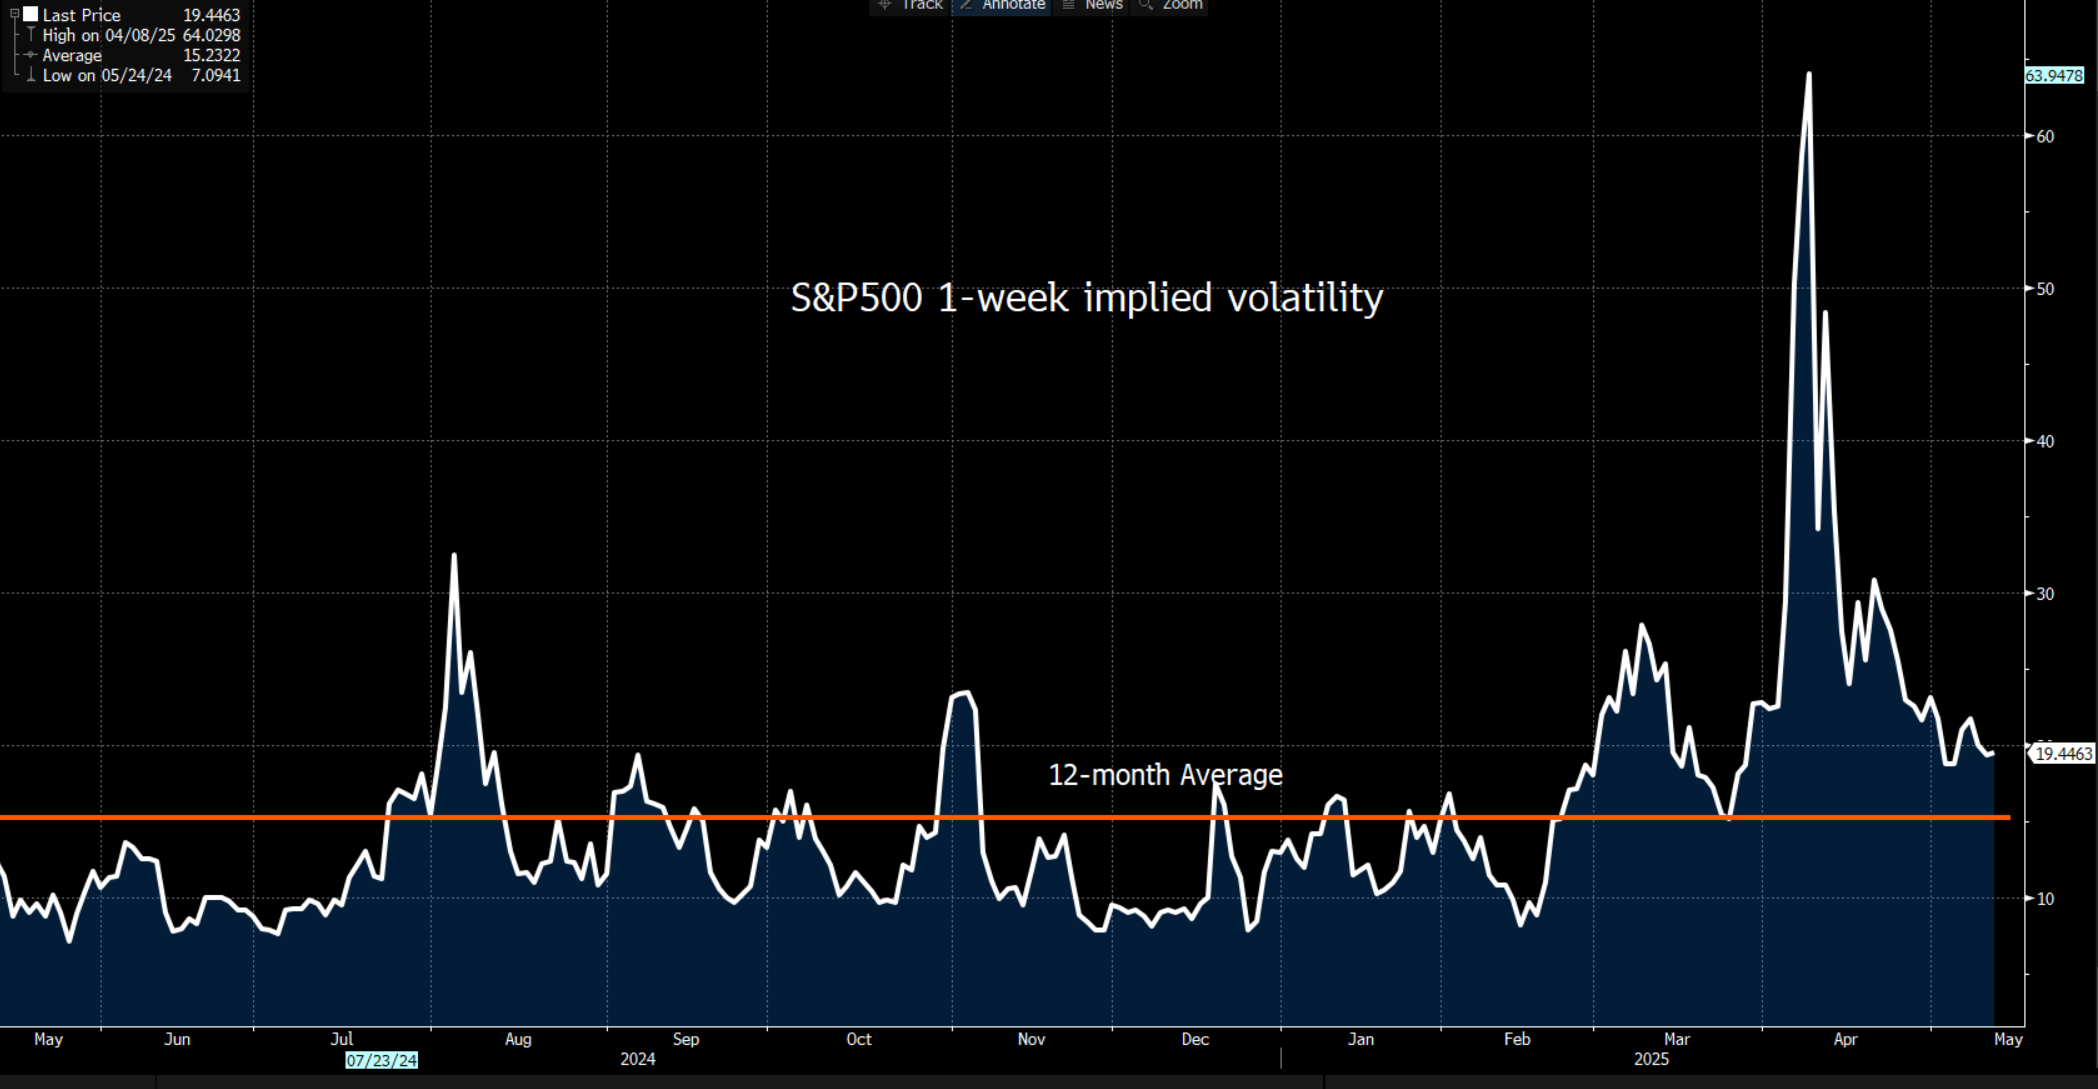
S&P500 1-week (options) implied volatility closed on Friday at 19.5%, which equates to an implied move (in the S&P500) over the week of -/+2.7%. From Friday’s closing levels, this puts an implied range for the week ahead of 5816 to 5507 in play, with the upper Bolling Band (currently at 5823) also highlighting where price could be seen as overextended relative to the 20-day mean price.
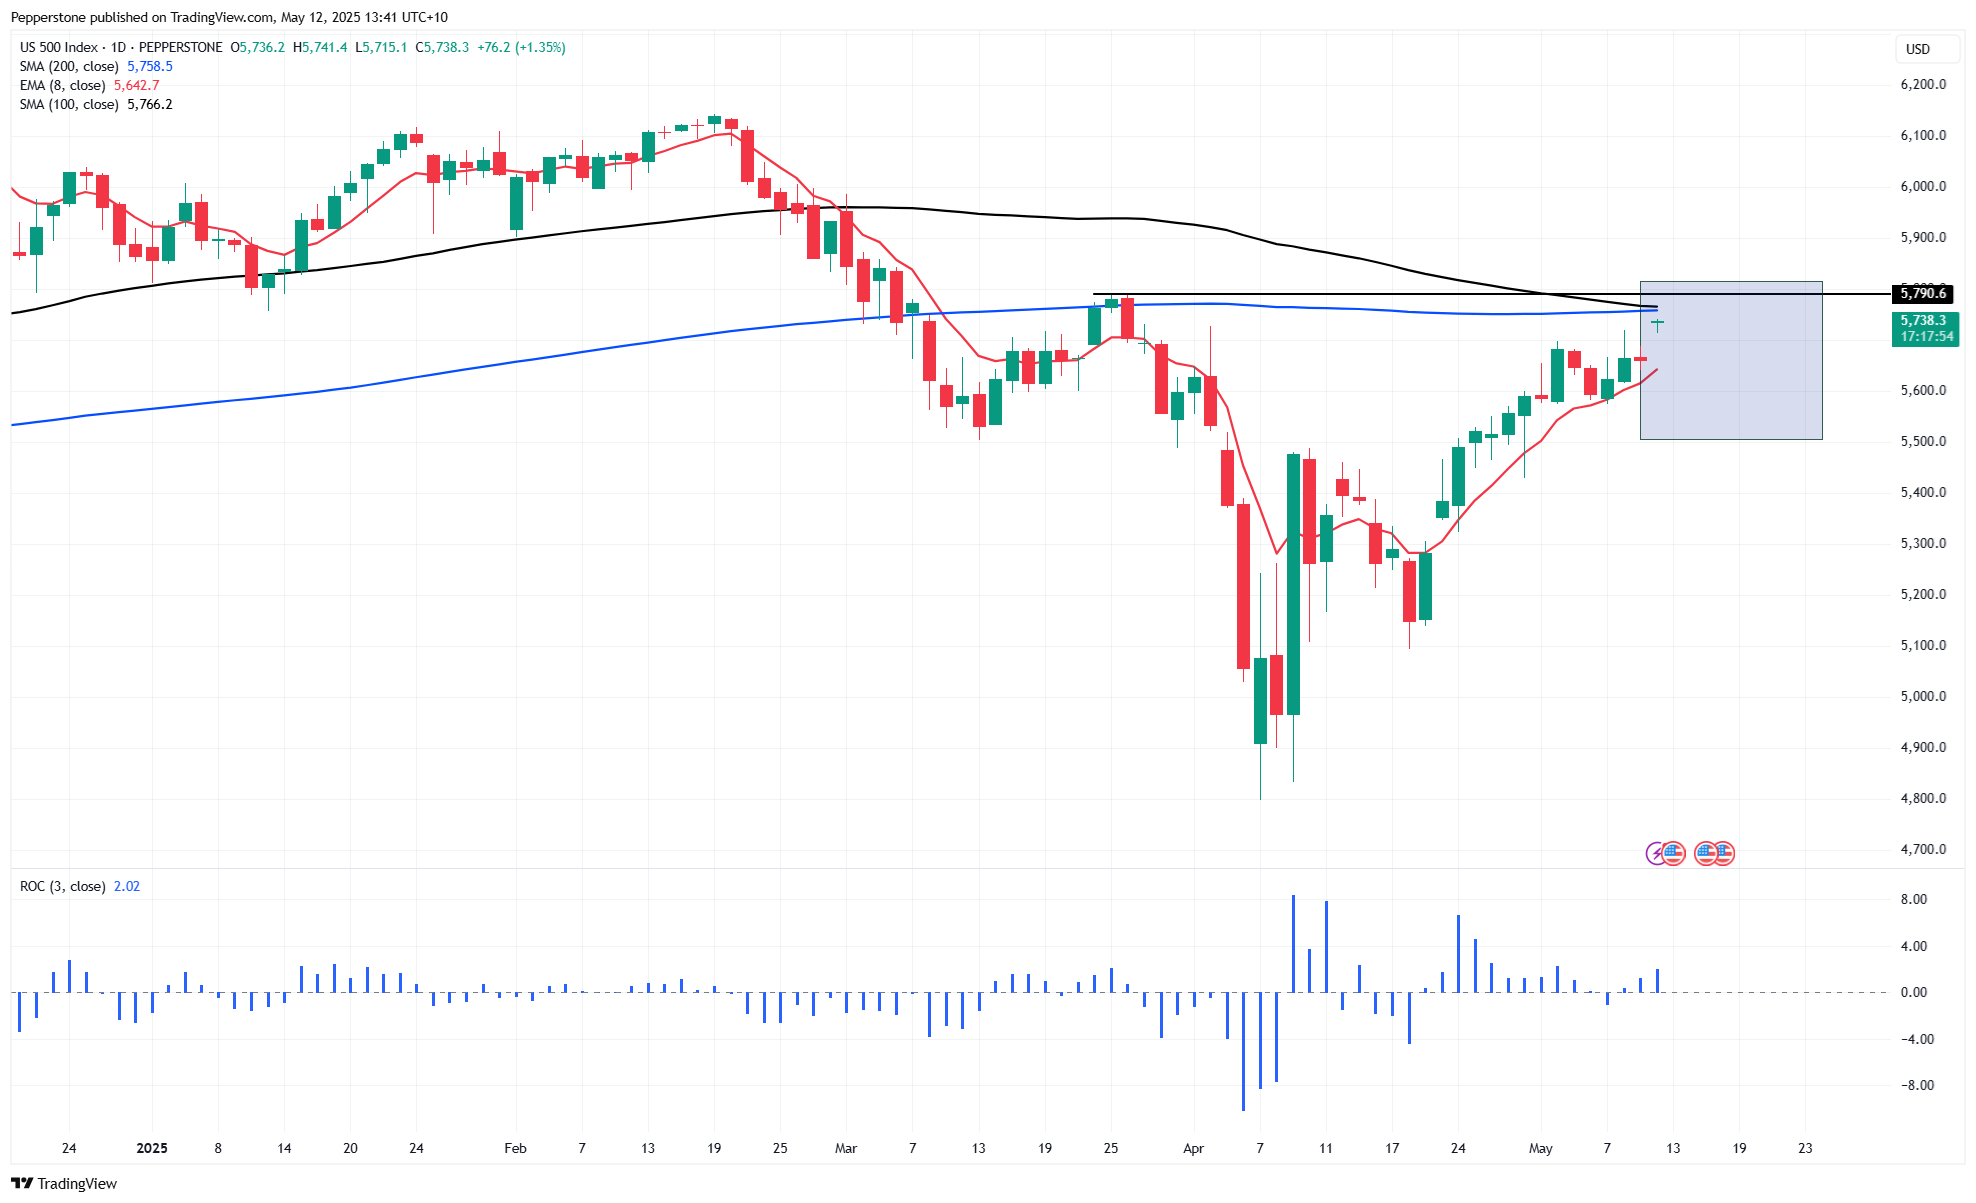
While this implied upper range would be where the positive rate of change (ROC) may slow, in the scenario where price is positively trending, one would expect the index to hug the upper Bollinger Band, with pullbacks contained into the 8-day EMA.
Technical Levels of Note
Ahead of 5823, it’s worth noting the near-term technical resistance, with the daily timeframe portraying some wood for the bulls to chop through to keep the upside momentum in check.
We note the 200-day MA at 5766 (5788 for S&P500 futures) - a level many have touted as where they may look to fade the rally and initiate short positions. This comes ahead of the 26 March high of 5788.1 (5837.5 in S&P500 futures).
Subsequently, a closing upside break of 5766/88 would raise the risk of a push into 5823.
Conversely, a daily close below the 8-day EMA would negate the short-term bullish directional bias and offer increased two-way (i.e. long and short) opportunity. A closing break of 5574 would naturally increase the risk of a move lower towards the implied range lows of 5500/10.
The Big Risk to the S&P500?
With S&P500 valuations pricing an impressive 16% EPS growth by end-2026, one can argue that there is almost no recession risk being priced. Fundamentally, that is a concern, although we may not see the negative effects of higher tariffs appear in the US hard economic data flow for at least two months, if at all. However, with portfolio hedges and short positioning cut back and implied levels of S&P500 volatility pulled back to the YTD average, there may not be much of a cushion should the incoming economic data show an accelerated pace of deterioration and market players bringing forward their anticipated recession timeline – a factor which in my view is arguably the biggest risk to equity markets over the medium-term.
Good luck to all.
The material provided here has not been prepared in accordance with legal requirements designed to promote the independence of investment research and as such is considered to be a marketing communication. Whilst it is not subject to any prohibition on dealing ahead of the dissemination of investment research we will not seek to take any advantage before providing it to our clients. Pepperstone doesn’t represent that the material provided here is accurate, current or complete, and therefore shouldn’t be relied upon as such. The information, whether from a third party or not, isn’t to be considered as a recommendation; or an offer to buy or sell; or the solicitation of an offer to buy or sell any security, financial product or instrument; or to participate in any particular trading strategy. It does not take into account readers’ financial situation or investment objectives. We advise any readers of this content to seek their own advice. Without the approval of Pepperstone, reproduction or redistribution of this information isn’t permitted.