A beginner's guide to technical analysis for UAE traders
Technical analysis offers traders valuable insights into market trends and price movements. This guide explores key technical indicators, explains their significance, and shows how incorporating them can enhance your trading strategy.
What is technical analysis as opposed to fundamental analysis?
Technical analysis involves examining historical market data, mainly price and volume, to predict future price movements. This approach assumes that a security's current price already incorporates all available information. Traders use technical analysis to identify trends, patterns, and shifts in market sentiment to anticipate how future prices may move.
Fundamental analysis evaluates the intrinsic value of an asset, often a stock, by examining various economic, financial, and qualitative factors. It involves analysing a company's or asset's underlying health and performance to determine whether it is overvalued, undervalued, or fairly valued.
Discover the key differences between fundamental analysis and technical analysis with Pepperstone’s in-depth guide.
Why is technical analysis so popular?
- Ease of Learning - Technical analysis is very accessible due to the availability of charts, tools, and online resources. Beginners can quickly grasp basic concepts like support and resistance levels, moving averages, and trend lines.
- Visual Representation - Charts and graphical representations help beginners understand market trends without needing in-depth financial knowledge.
- Short-Term Focus - Many beginners are attracted to short-term trading opportunities. Technical analysis provides immediate feedback, allowing traders to make quicker decisions and see results faster.
- Market Sentiment - Technical analysis captures market psychology, which can appeal to those who want to understand how emotions and trends affect price movements.
- Utilising tools and Platforms - Many trading platforms come equipped with built-in technical analysis tools. This feature makes it incredibly convenient for beginners to experiment with different strategies, enhancing their learning experience.
Price history, volume, and market data are all used to make future price predictions, but what should you focus on the most?
In technical analysis, traders use price history, volume, and other market data to identify patterns and trends that can help predict future price movements. Here's how each of these elements is used:
Price History
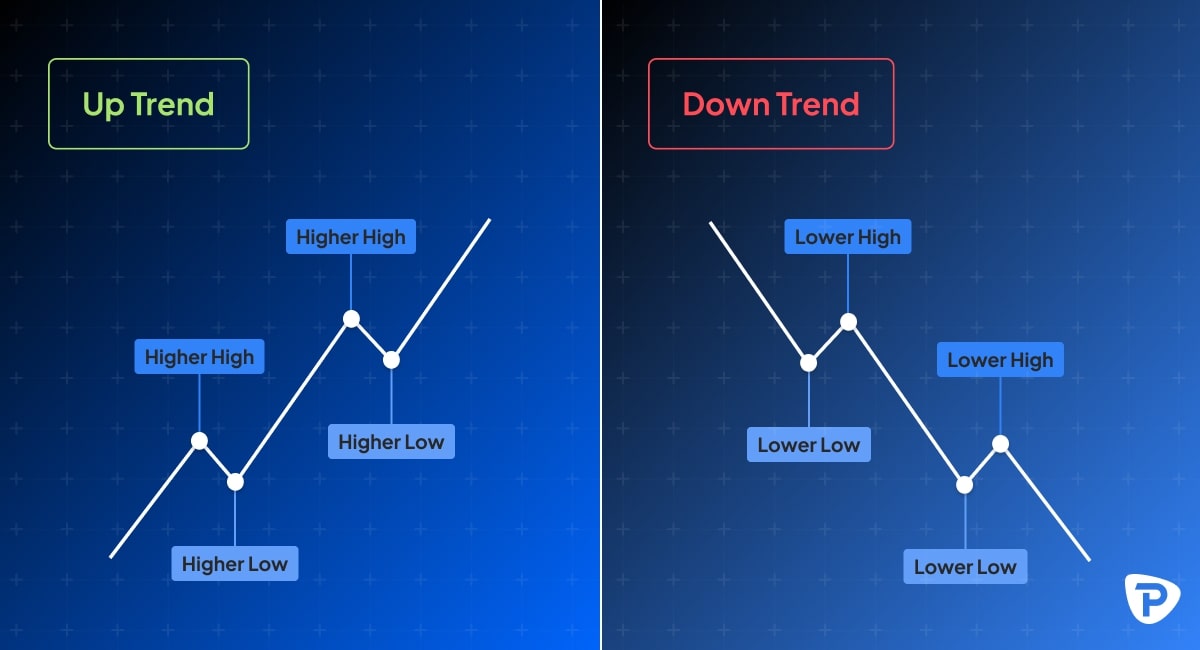
Trends: Price history reveals whether a security moves upwards, downwards, or range-bound (moving sideways). Traders analyse these trends to predict the future direction of prices.
- Uptrend: A series of higher highs and higher lows.
- Downtrend: A series of lower highs and lower lows.
Uptrend and Downtrend lines example
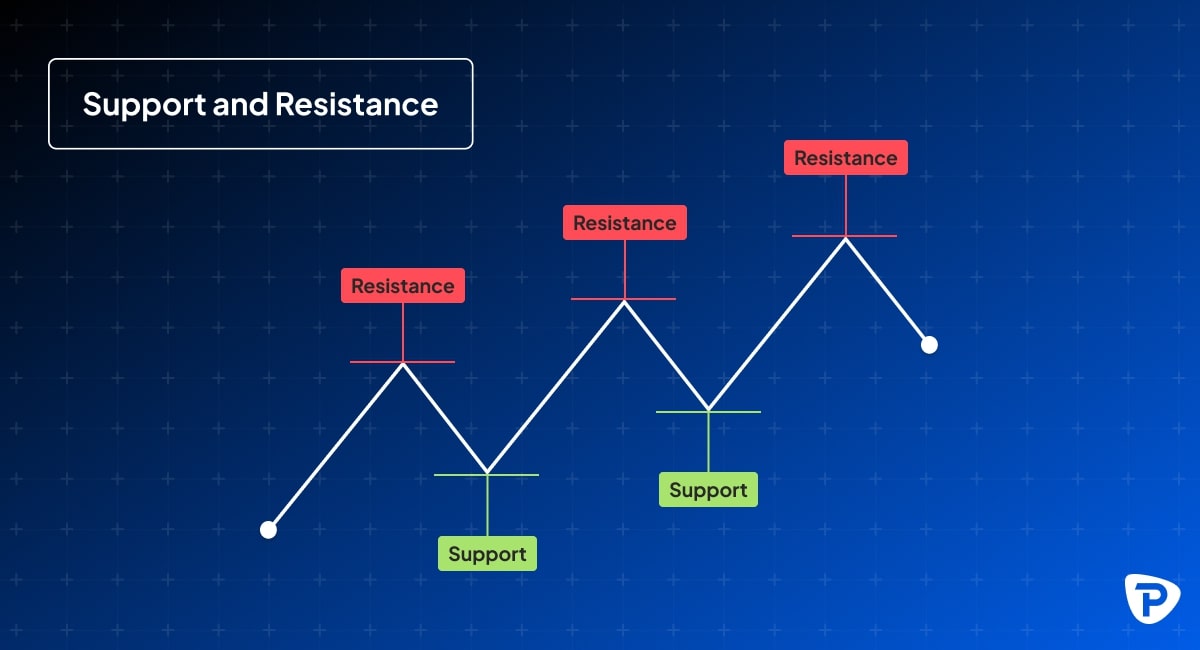
Support and Resistance: Historical price data helps identify support levels (where the price tends to stop falling) and resistance levels (where the price tends to stop rising). These levels indicate potential turning points in price movement.
Support and Resistance example
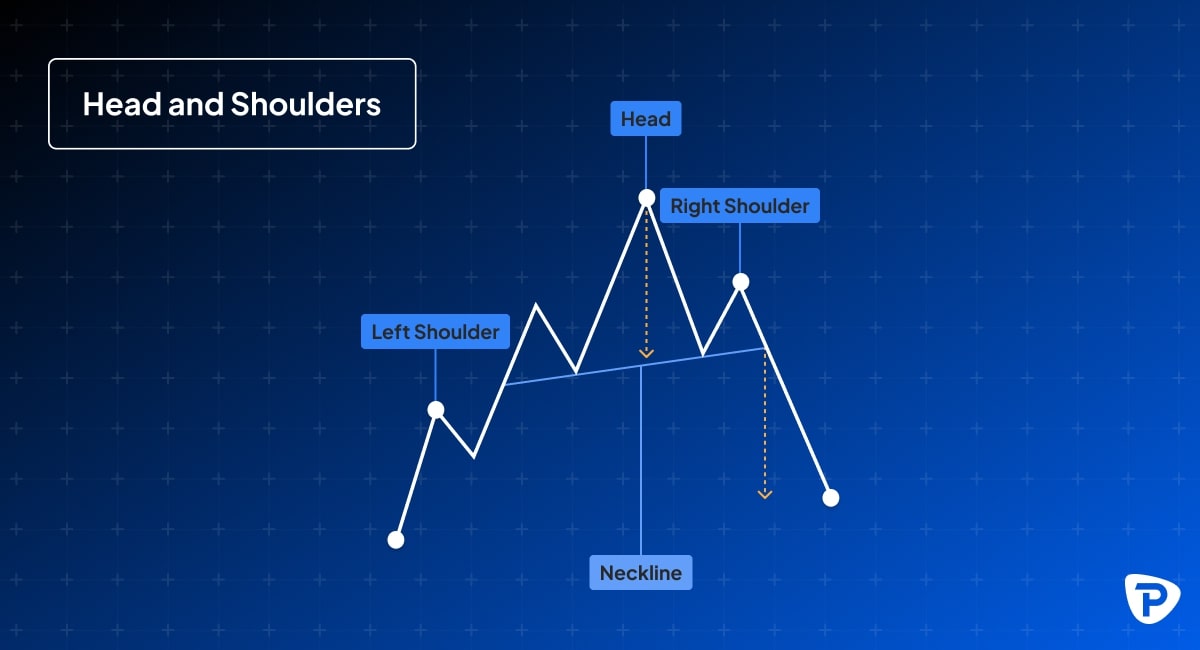
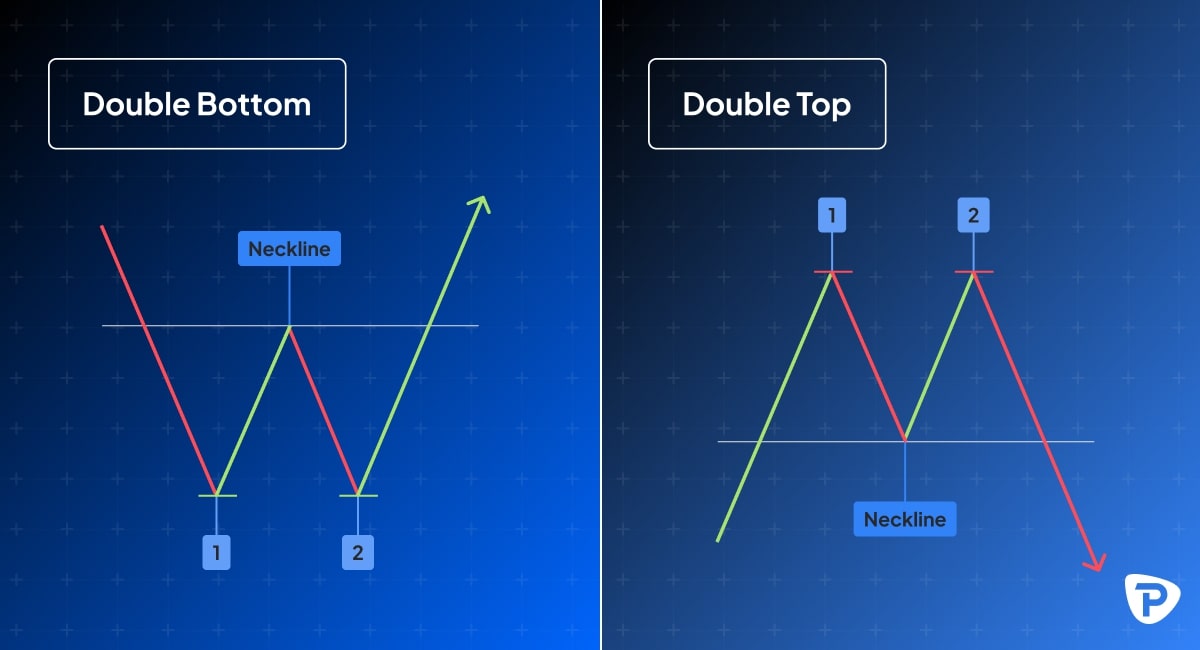
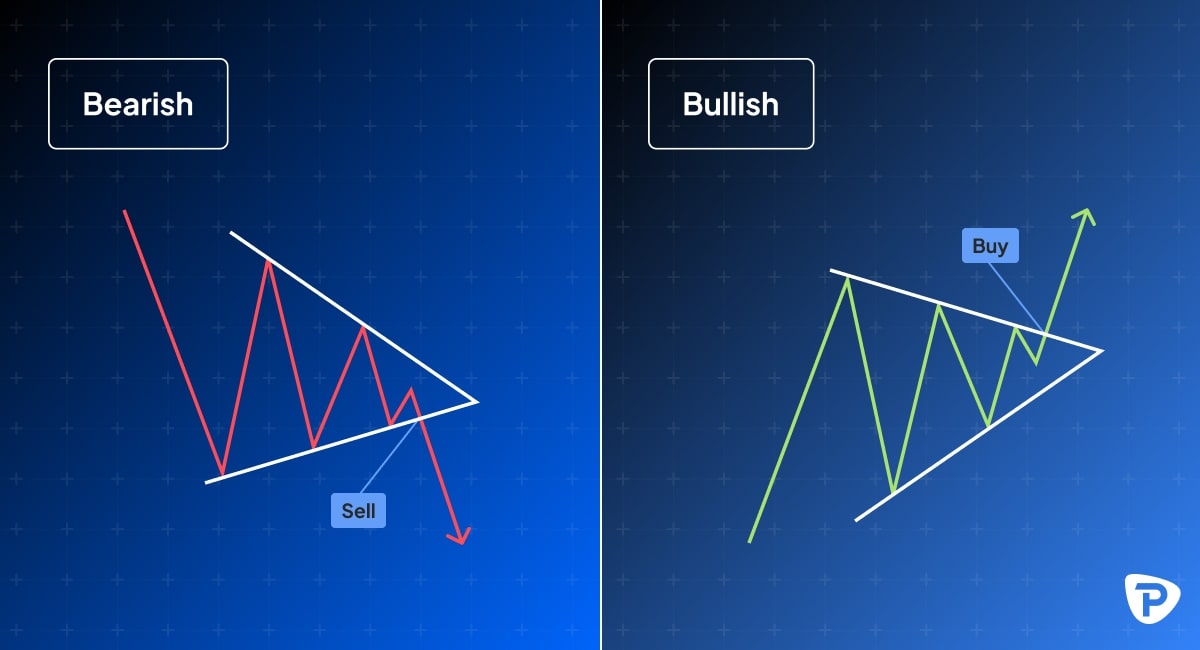
x: Certain patterns formed by price movements over time, like head and shoulders, double tops/bottoms, or triangles, are used to predict future price direction. These patterns are based on historical occurrences where similar shapes in price data have led to predictable outcomes.
Head and Shoulders example
Double Bottom & Double Top examples
Triangle examples
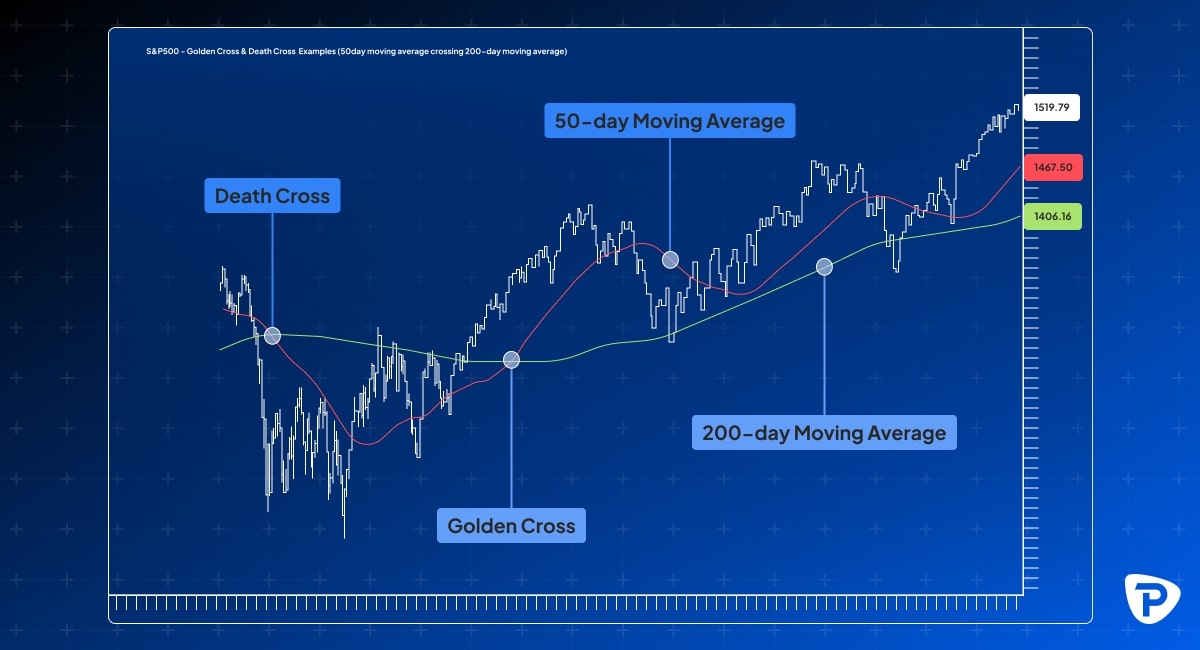
Moving Averages: Traders use moving averages to smooth out price data, highlighting trends by averaging past prices over a set period (e.g., 50-day or 200-day moving averages). When a shorter-term moving average crosses above a longer-term one, it can signal a buying opportunity (Golden Cross). When it crosses below, it may signal a selling opportunity (Death Cross).
Golden Cross & Death Cross examples (50-day ma crossing 200-day ma)
Volume
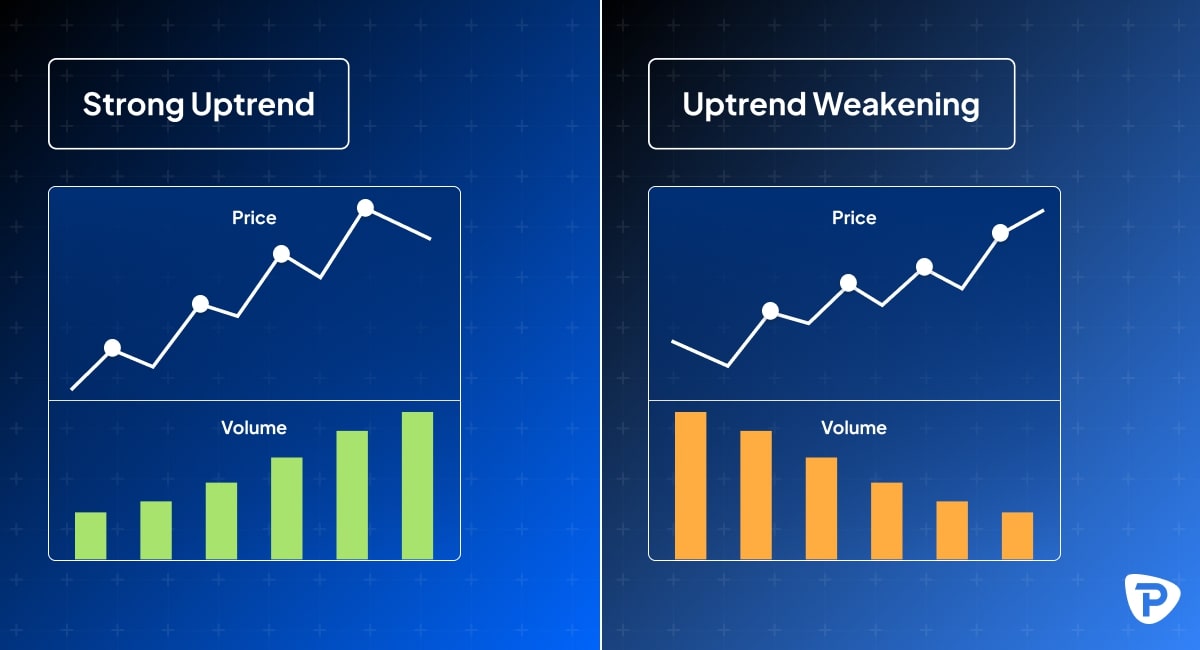
- Confirmation of Trends: Volume refers to the number of shares or contracts traded during a given period. When volume increases in the direction of a price trend, it confirms the strength of that trend.
- Volume Spikes: Sudden volume increases can signal potential trend reversals or significant price movements. If a stock falls sharply with high volume, it may indicate panic selling, whereas a sharp rise with high volume could signal aggressive buying.
- Divergence: Traders also look for discrepancies between price and volume. For example, if prices rise but volumes decrease, it could signal a weakening trend and potential reversal.
Price / Volume relationship
Market Data Indicators
- Indicators and Oscillators: Technical traders use various indicators derived from market data to identify momentum, overbought/oversold conditions, and trend strength. Some commonly used indicators include:
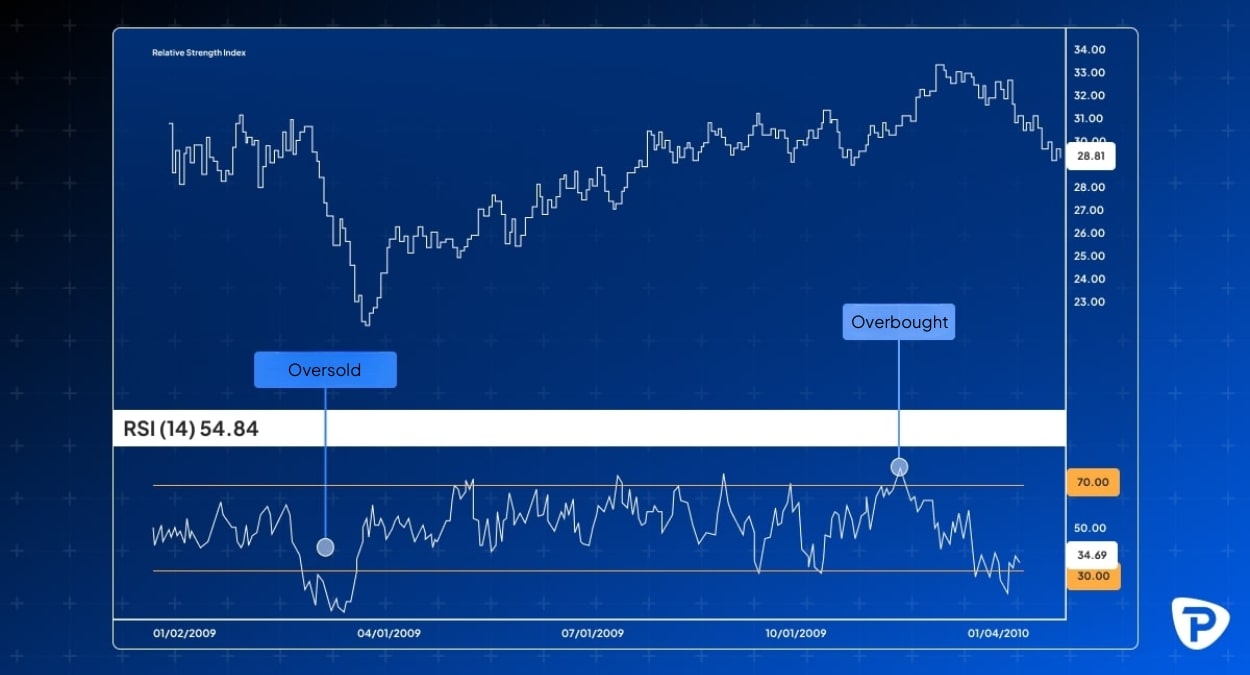
- Relative Strength Index (RSI): This measure of momentum measures the speed and change of price movements and helps identify whether a security is overbought (typically above 70) or oversold (typically below 30).
Relative Strength Index example
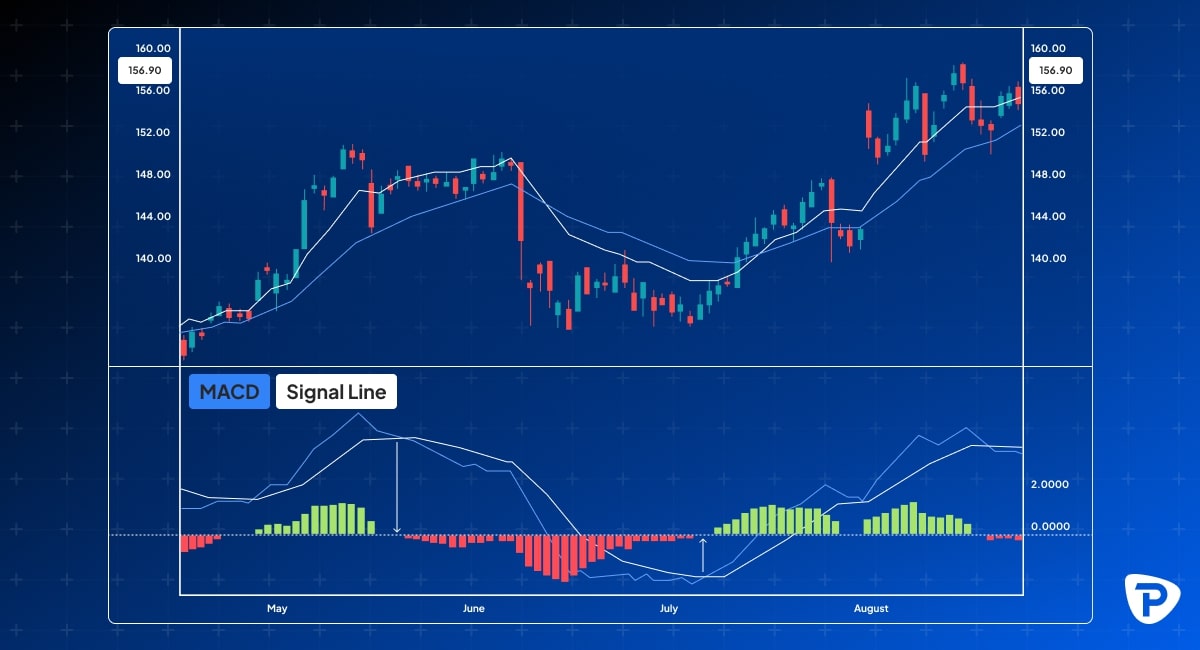
- Moving Average Convergence Divergence (MACD): This indicator combines two moving averages and helps identify potential trend changes and momentum shifts, generating buy or sell signals.
Moving Average Convergence Divergence example
What other charts are commonly used in technical analysis?

Can I include technical analysis in my risk management?
Technical analysis tools for risk management help traders examine historical market data to pinpoint critical levels on a price chart where a potential price reversal or breakout may occur. These points serve as key decision-making areas. If a trade is losing value, these levels indicate where the price could reverse, allowing the trader to recover losses. Conversely, if the price continues to move beyond the set level, it can signal the failure of the trading strategy, and exiting the trade may prevent further losses.
Before applying a risk management plan, it's essential to reflect on its objectives and avoid common pitfalls, such as:
- Anticipating a rebound too optimistically
- Failing to establish a clear trading plan
- Allowing emotions or biases to influence decisions
- Taking overly large positions
- Not closely monitoring trades
Stop-Loss Orders
A stop-loss order is one of the most common tools for managing risk in technical analysis. This automated order triggers the reduction or closure of a position once it reaches a specific price level. Various indicators can help determine potential support or resistance levels. If the price moves beyond these levels, it often indicates a significant shift in market conditions, and closing the position can help limit further losses.
Position Sizing
Taking smaller positions can help remove emotional reactions from trading and encourage discipline in your strategy. Position sizes should be tailored to the risk-to-reward profile of the trade and adjusted for changes in market volatility. Defining what "small" means for your trading strategy is also essential. For example, some experienced traders limit the risk per trade to 1% of their total capital to maintain discipline.
Risk-Reward Ratio
Managing position size can also be refined by assessing the probability of success and the likelihood of losses in a trade and adjusting your risk-reward ratio accordingly. When confidence in a trade is higher, a more significant portion of capital may be risked, while riskier trades should see smaller allocations. After determining the maximum acceptable loss, it’s crucial to consider the potential profit. A well-calculated risk-reward ratio, such as 1:3, means that even if only 33% of your trades are successful, you could still achieve overall profitability despite potential losses.
Can I combine technical indicators?
There are various types of technical indicators, each with its pros and cons, generally categorised into two groups:
- Lagging indicators rely on past price data, making them slower to reflect market changes. A typical example is Moving Averages.
- Leading indicators analyse current market conditions and can signal potential price movements before they happen. The Relative Strength Index (RSI) is an example of this.
Relying on a single indicator can be risky, as it may not offer a full view of the market. Using multiple indicators together helps provide more reliable insights and confirms potential price trends. For instance, while the Moving Average Convergence Divergence (MACD) can signal trend reversals, it may not always be accurate on its own. To strengthen the decision, a trader could also use the RSI. If the RSI indicates an overbought market and the MACD suggests a bearish trend, both indicators reinforce the likelihood of a potential reversal, making the case for entering a short position stronger. Therefore, combining indicators to identify converging signals can provide a more robust analysis, increasing the chances of a successful trade.
What time frames should I use?
Here are some helpful tips to guide your decision when selecting a time frame for trading using Technical Analysis:
- Try Demo Trading: Use a demo account to experiment with different time frames. This allows you to understand how each one works without risking real money. Track your results to determine which time frame and strategy best suit your trading style.
- Consider Your Lifestyle: Choose a time frame that aligns with your daily routine and preferences. Short-term trading might be ideal for those who can dedicate more time each day and want to focus on quick market movements. On the other hand, Swing trading (which attempts to capture short to medium-term gains over a period of a few days to several weeks) may be better for individuals who can check the market regularly but aren't as concerned with short-term fluctuations.
- Be Consistent: Once you've selected a time frame, stick with it. Constantly switching between time frames can create confusion and lead to mistakes. While both short and long-term trading offer potential gains and losses, the strategies and skills required for each vary significantly.
Ultimately, the best time frame for trading depends on your goals, trading style, risk tolerance, and lifestyle.
Conclusion
Technical analysis is a powerful tool for traders to forecast market movements by examining price history, volume, and various indicators. Whether using lagging indicators like moving averages or leading indicators such as RSI, traders can gain insights into market trends and make informed decisions. However, relying on a single indicator can be risky, so combining multiple indicators often provides a more accurate picture of potential market direction.
Risk management also plays a crucial role in trading success using Technical Analysis. Tools like stop-loss orders, position sizing, and risk-reward ratios help traders limit losses and stay disciplined. Choosing the right time frame is another critical factor, as it should align with your trading goals and lifestyle, whether you prefer the rapid pace of short-term trading or the steadier approach of swing trading.
Ultimately, mastering technical analysis, developing a consistent strategy, and remaining disciplined in risk management are key to navigating the complexities of the market. While the tools and techniques discussed in this article provide valuable insights, continual learning and practice are essential for long-term trading success.
The material provided here has not been prepared in accordance with legal requirements designed to promote the independence of investment research and as such is considered to be a marketing communication. Whilst it is not subject to any prohibition on dealing ahead of the dissemination of investment research we will not seek to take any advantage before providing it to our clients.
Pepperstone doesn’t represent that the material provided here is accurate, current or complete, and therefore shouldn’t be relied upon as such. The information, whether from a third party or not, isn’t to be considered as a recommendation; or an offer to buy or sell; or the solicitation of an offer to buy or sell any security, financial product or instrument; or to participate in any particular trading strategy. It does not take into account readers’ financial situation or investment objectives. We advise any readers of this content to seek their own advice. Without the approval of Pepperstone, reproduction or redistribution of this information isn’t permitted.