How to trade GBP/USD: Influential factors and essential strategies
When trading GBP/USD it’s crucial to understand the factors that influence its movements, effective strategies, and how to manage risk properly. This guide provides insights into all these aspects, focusing on how to make informed trading decisions.
What factors influence the price of GBP/USD?
Several key factors influence the price of GBP/USD, reflecting both the economic and geopolitical relationship between the UK and the US. The main factors include:
Interest Rates and Central Bank Policies
The Bank of England (BoE) and the Federal Reserve (Fed) set interest rates and control monetary policy, which directly affect the strength of their respective currencies. Higher interest rates generally make a currency more attractive, leading to increased demand. For example, if the BoE raises rates while the Fed keeps them stable, GBP/USD could rise as the pound becomes more appealing.
Economic Data
UK and US economic indicators such as GDP growth, inflation, employment data, and retail sales heavily influence GBP/USD. Positive data from either country can strengthen its currency.
Geopolitical Events
Political events such as Brexit, trade agreements, or elections can create volatility in GBP/USD. Uncertainty or instability often leads to fluctuations, with the pound weakening during times of UK political uncertainty and the dollar strengthening as a safe haven in times of global instability.
Market Sentiment and Risk Appetite
GBP/USD is sensitive to global risk sentiment. During periods of risk-on sentiment, investors may prefer what are often considered, in relation to the USD, riskier assets like the pound. In contrast, during risk-off periods (e.g., economic downturns or wars), the USD, as a safe-haven currency, often strengthens.
Trade Balance
The UK's trade balance with the US can also play a role. If the UK exports more than it imports from the US, generally demand for GBP increases, pushing GBP/USD higher.
Inflation Rates
Differing inflation rates between the UK and the US can also drive movements in GBP/USD. High inflation in the UK may weaken the pound, while stable inflation in the US could boost the dollar.
Corporate Actions
During large mergers and acquisitions involving UK or US companies, demand for GBP/USD can increase as large cross-border transactions drive currency flows, often leading to temporary volatility in the pair.
Fundamental analysis of all these factors is essential for traders looking to understand and anticipate price movements in GBP/USD.
When is the optimal time to trade GBP/USD?
The best time to trade GBP/USD is during periods of high liquidity, typically when the London and New York sessions overlap. This occurs from 12:00 PM to 4:00 PM GMT, during which there is increased trading activity and tighter spreads. These hours often present the best opportunities for day traders due to volatility and market-moving news releases.
What are the most important technical indicators for trading GBP/USD?
Moving Averages (MA)
GBP/USD can on occasions be highly volatile. Moving averages help smooth out short-term price fluctuations, enabling traders to focus on the underlying trends rather than short-term volatility. The 50- and 200-day moving averages in particular can help identify longer term trends.
Relative Strength Index (RSI)
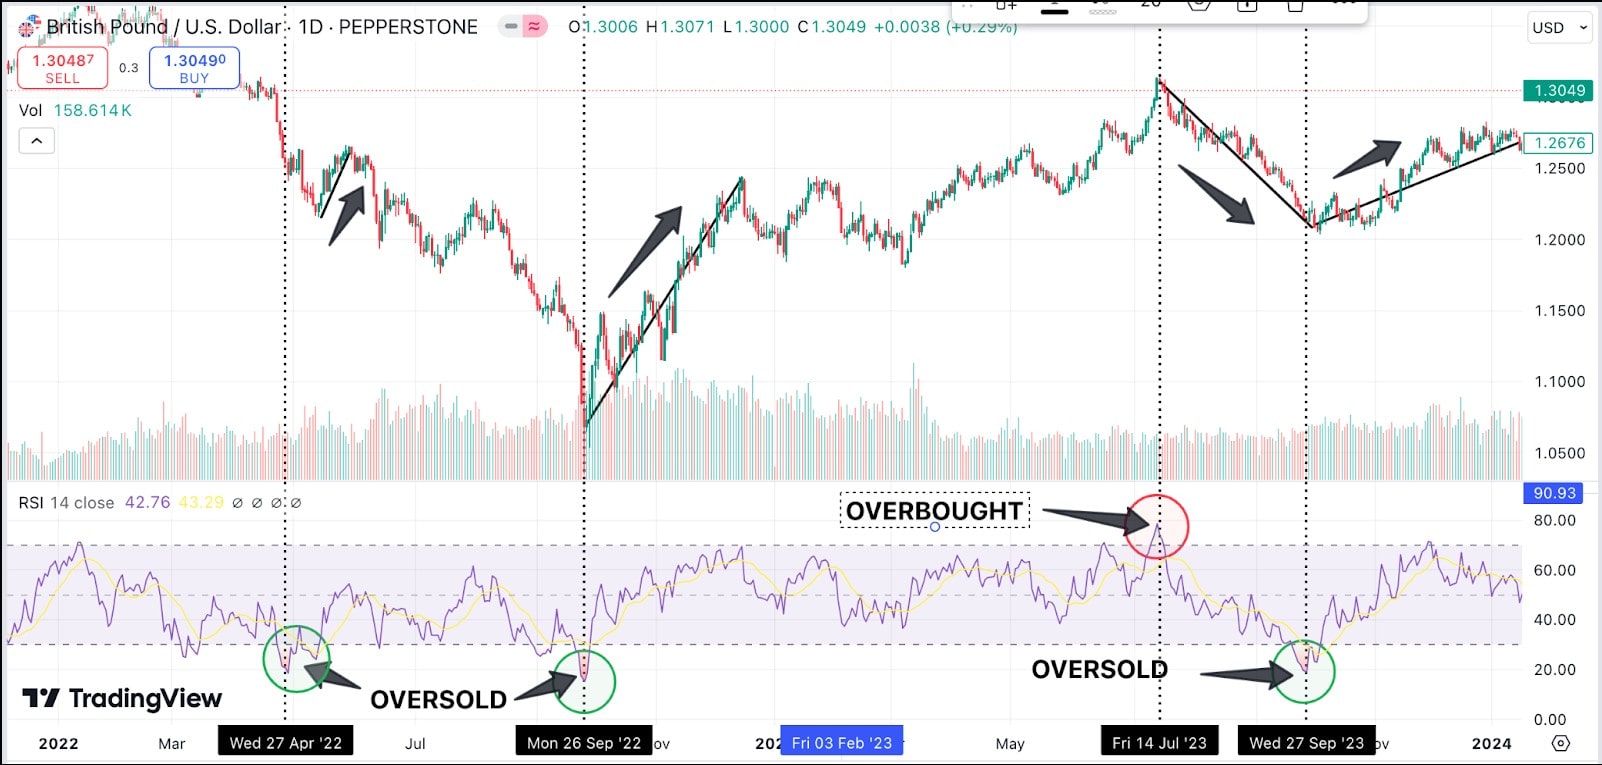
When RSI exceeds 70, it signals overbought conditions, potentially signalling a reversal or sell opportunity. Conversely, when RSI drops below 30, it indicates oversold conditions, suggesting a possible buying opportunity. The GBP/USD chart (below), overlaid with RSI, shows that it has been useful in identifying overbought and oversold conditions. However, RSI should always be used alongside other indicators and market context to avoid false signals.
Support and Resistance Levels
Identifying historical support and resistance zones helps in timing trades, managing risk, and spotting breakout opportunities. These zones reflect recurring market sentiment, helping traders anticipate future price movements helping in timing trades, managing risk, and spotting breakout opportunities. In GBPUSD, long term support and resistance zones are clearly identifiable from the chart below:
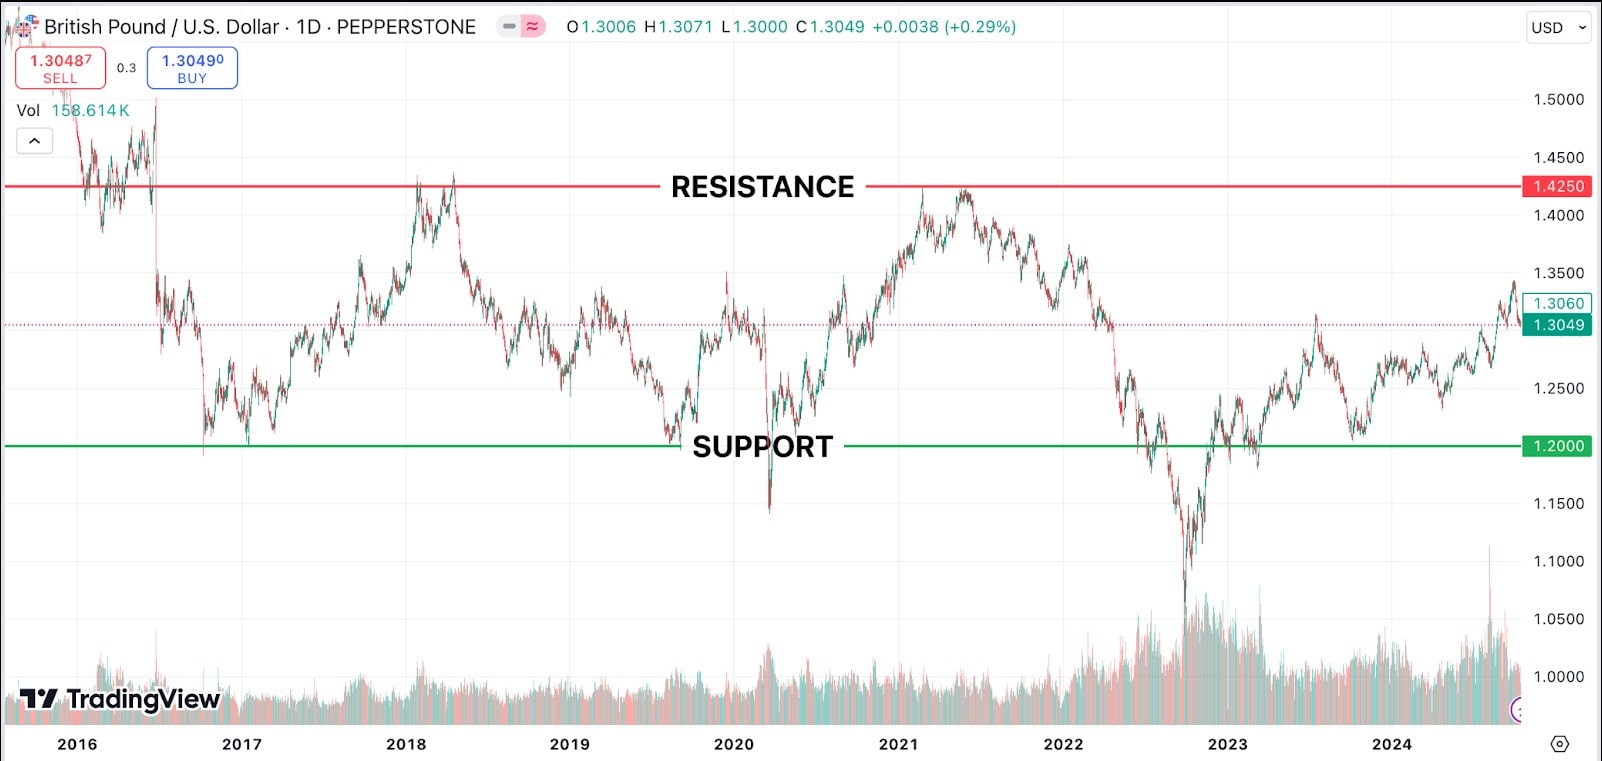
Support around 1.2000: This level has been tested multiple times since 2017, acting as a key price floor where the pair found demand.
Resistance around 1.4250: Historically, this has acted as a strong barrier. Breakouts above this level, particularly on high volume, can offer bullish breakout opportunities.
What is the typical spread for trading GBP/USD?
The spread for GBP/USD can vary depending on the broker, market conditions, and liquidity, but it is generally lower compared to more exotic currency pairs due to the high trading volume. On average, the spread for GBP/USD ranges between 0.5 to 2 pips during liquid market hours. It may widen during volatile times or outside major trading sessions. For example, Pepperstone's average spread for GBP/USD is 1.0 pip, with a minimum spread of 0.9 pip. Pepperstone also offers a Razor account with an average spread of 0.38 pips for GBPUSD trading Monday through Friday.
How can I start trading GBP/USD using CFDs?
Four key steps to start trading GBP/USD using CFDs:
- Open an account: Begin by opening an account with a CFD broker, such as Pepperstone, which offers a selection of trading platforms and access to GBP/USD prices.
- New traders can get to grips with the trading platform and the markets by using a demo account which simulates live market conditions and trading without the need to risk any real money.
- Fund your account: Once your trading account is open, you will need to fund it by making a deposit.
- Download the Trading Platform: Download the trading platform provided by your broker and familiarise yourself with its features and functionality.
- Start Trading: After gaining confidence in using the trading platform, you will be ready to start trading GBP/USD on your live account..
- Pepperstone trades in what are known as CFDs, or Contracts For Differences, which are cash-settled and non-deliverable. This allows you to trade long or short with equal ease, without worrying about the ownership or delivery of the underlying commodity.
How can I manage risk when trading GBP/USD?
Effective risk management is crucial in GBP/USD trading. Some key principles to consider and adhere to:
Use Stop-Loss Orders: Set stop-loss levels to limit losses on each trade. For example, if a long (buy) GBP/USD trade is being entered, place a stop-loss just below a key support level.
Position Sizing: Traders should avoid risking more than 1-2% of trading capital on any single trade. This will ensure that even a series of losing trades doesn’t significantly impact account balance.
Diversify Trades: Don’t rely solely on GBP/USD. Spreading risk across currency pairs or asset classes can reduce overall exposure to unexpected market events.
How can I set effective stop-loss and take-profit Levels for GBP/USD?
To set effective stop-loss and take-profit levels, consider the following processes:
Support and Resistance
Place a stop-loss just beyond key support (for a long trade) or resistance (for a short trade) levels. For example, based on a hypothetical trade entry price of 1.3025 (chart below) for both a long and short trade in GBP/USD, here’s how potential trades could be managed using key support and resistance levels:
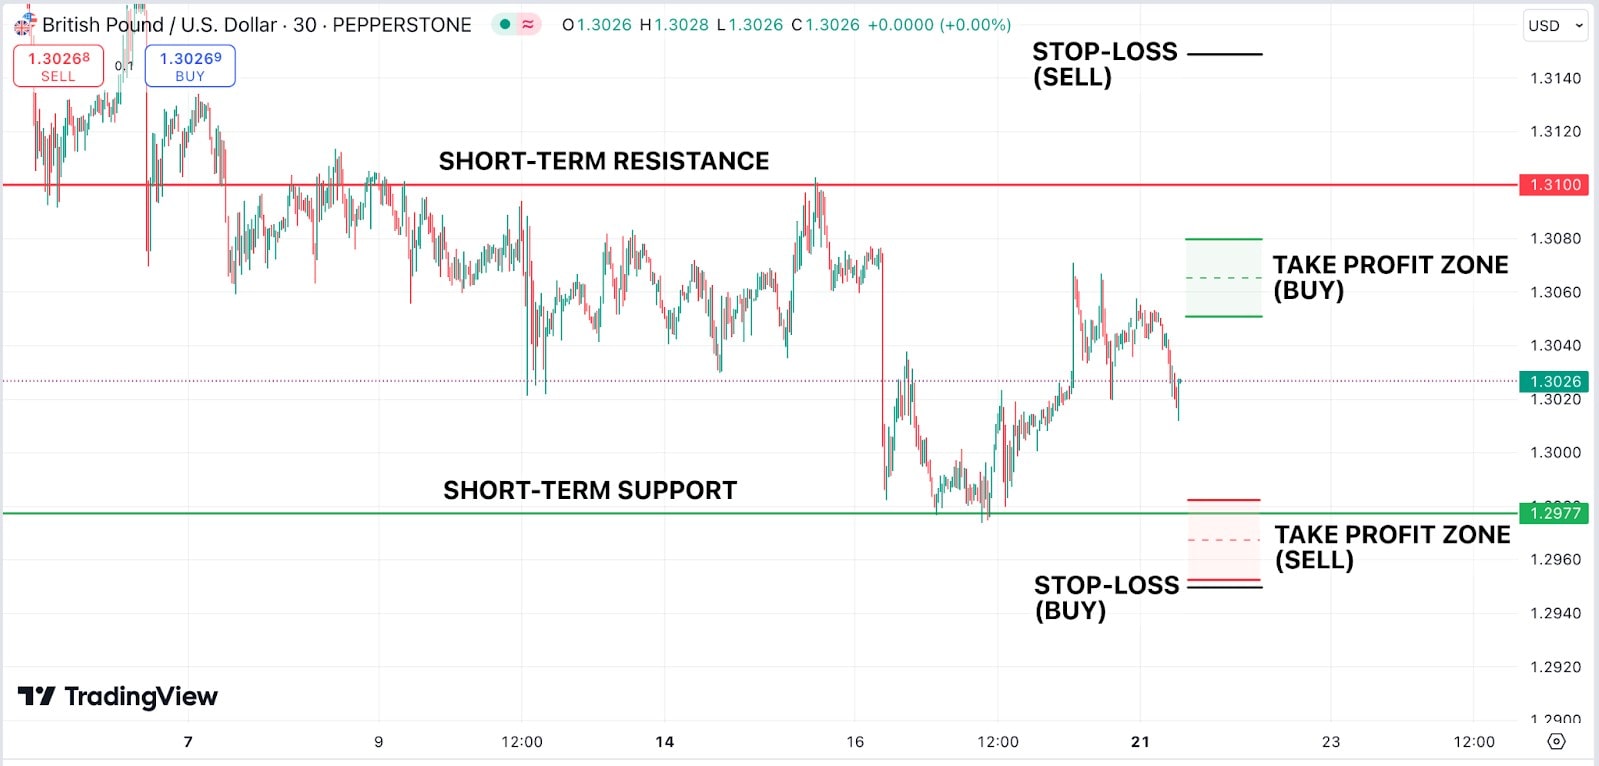
Long Trade (Buy at 1.3025):
Stop-loss: Set below the nearest support level, around 1.2950. This offers protection from further downside if the price falls below support.
Take-profit: A target just under the next significant resistance level could be considered near 1.3100. A reasonable take-profit range under this scenario would be around 1.3050-1.3080.
Short Trade (Sell at 1.3025):
Stop-loss: Placed slightly above the resistance level at 1.3150. If the price moves above this level, it could signal a potential reversal, consider closing the trade before significant losses.
Take-profit: Target the support area around 1.2950-1.2980. This would allow for the trade to be exited as it approaches the lower support zone.
Using this approach can help balance the risk and reward by positioning stop-loss and take-profit levels based on chart patterns.
ATR (Average True Range)
ATR can be used to gauge GBP/USD's typical volatility and set stop-losses at a certain multiple of the ATR away from an entry to avoid being stopped out by normal fluctuations. The ATR is a tool that helps show how much a currency pair like GBP/USD typically moves over a certain period. ATR is usually set to 14, meaning it shows the average movement over the previous 14 hours. If the ATR in this example is 0.0077, it means the GBP/USD pair is moving about 77 pips on average per hour. This can help in the decision making process. Based on the same trade entry price of 1.3025 as the support and resistance example above, and the ATR value on the chart of 0.0077:
For a Buy (Long) Trade:
1.3025 - 0.0077 = 1.2948
A stop-loss could be placed around 1.2948 to give the trade room for small movements.
For a Sell (Short) Trade:
1.3025 + 0.0077 = 1.3102
A stop-loss could be placed around 1.3102.
These levels help account for market volatility, preventing small fluctuations from closing a trade too early. ATR doesn't suggest which direction the price will go, but it does show how much the price is likely to move, helping with risk management.
Risk-to-Reward Ratio
Aim for a minimum risk-to-reward ratio of 1:2. If risking 20 pips, take-profit should be at least 40 pips.
Should I use leverage when trading GBP/USD? If so, how much?
Leverage allows traders to control larger positions with smaller amounts of capital, but it also increases the risk of substantial losses. Beginners should be cautious with leverage as it can amplify both gains and losses.
For beginners, 1:10 leverage is generally considered safe, meaning £10,000 can be controlled with £1,000 in capital. Intermediate traders might use leverage up to 1:30, but it’s essential to adjust risk management strategies to account for the increased exposure.
Always be aware of broker margin requirements and the risks of a margin call.
What is the correlation between GBP/USD and other currency pairs or assets?
The GBP/USD pair shows notable correlations with several other currency pairs and financial assets, which can help understand potential price movements.
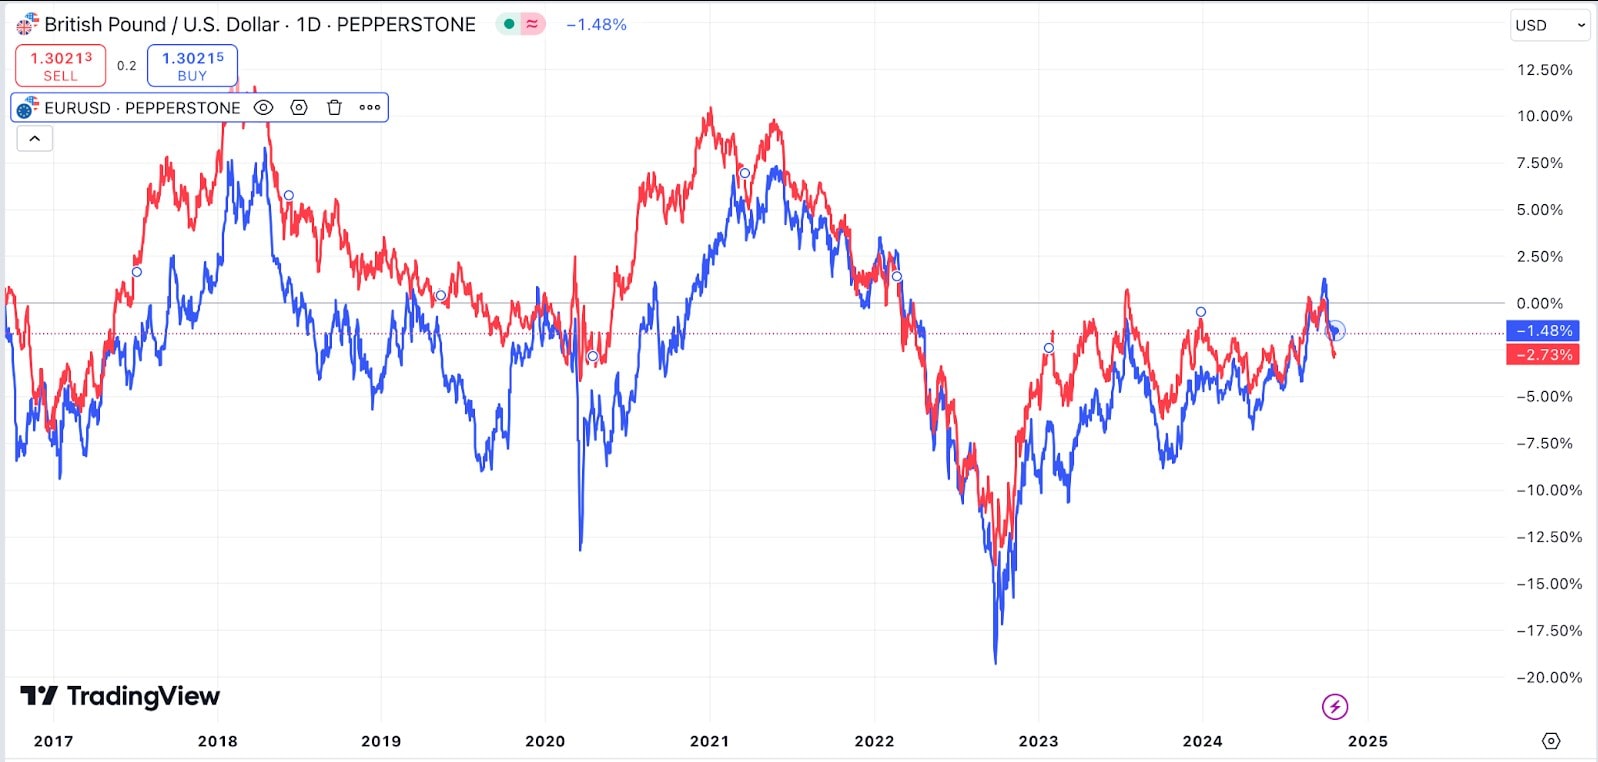
EUR/USD and GBP/USD: These two pairs often exhibit a strong positive correlation because both pairs involve the U.S. dollar, and the economies of the Eurozone and the UK are closely linked through trade and financial ties. Historically, the correlation has been close to +0.8, meaning they tend to move in the same direction around 80% of the time:
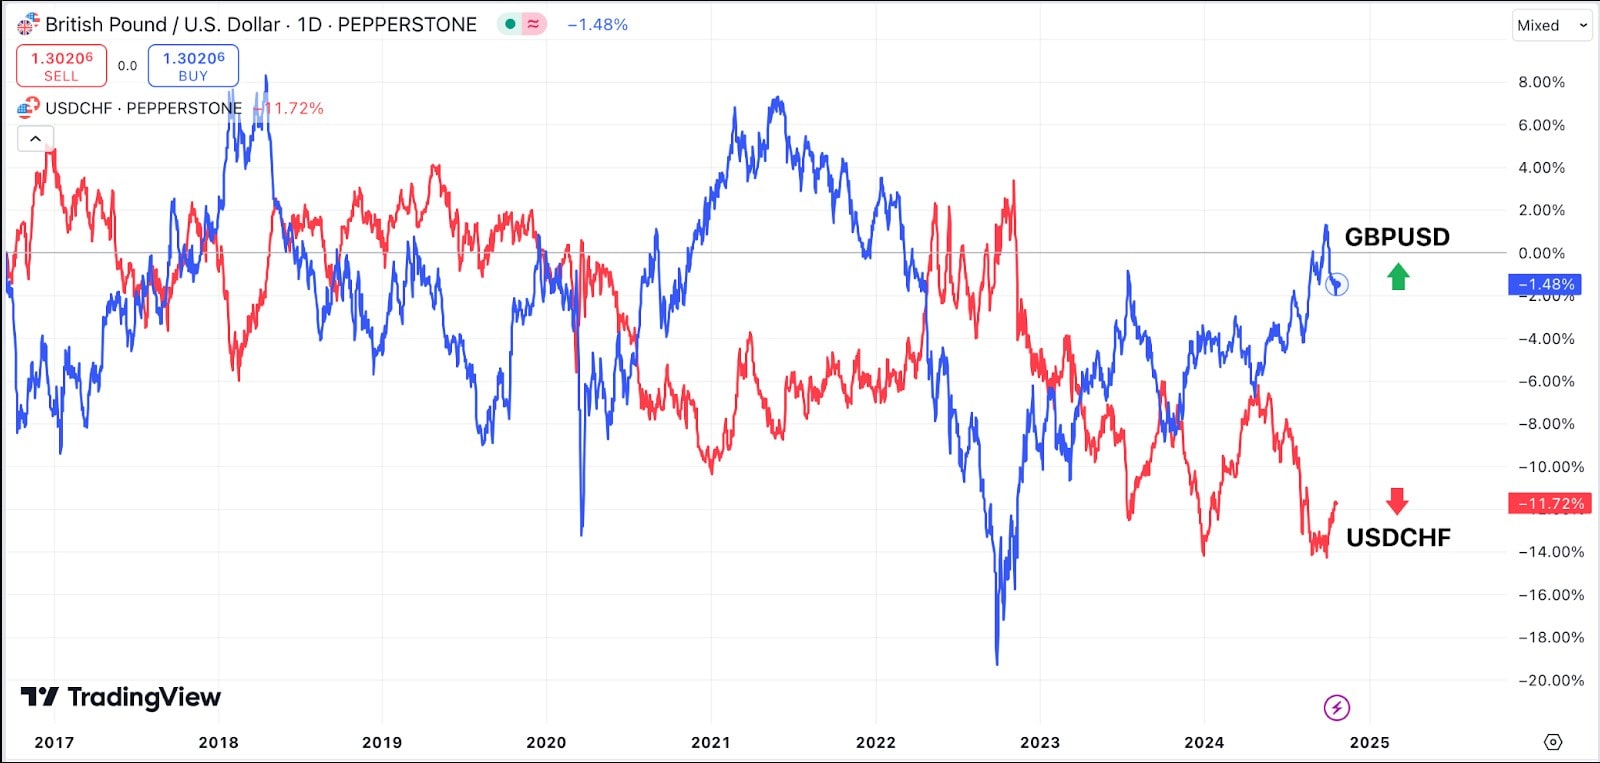
USD/CHF: On the other hand, GBP/USD usually has a strong negative correlation with USD/CHF. This negative correlation, typically around -0.85, means that when GBP/USD rises, USD/CHF tends to fall. This is due to the relationship between risk sentiment and the Swiss franc:
Commodities: The correlation between GBP/USD and commodities, especially Gold (XAU/USD), is also notable. The pair tends to exhibit some positive correlation with gold prices because both GBP and gold benefit when the U.S. dollar weakens. However, this correlation is less strong than that between currency pairs, and it can vary depending on macroeconomic conditions.
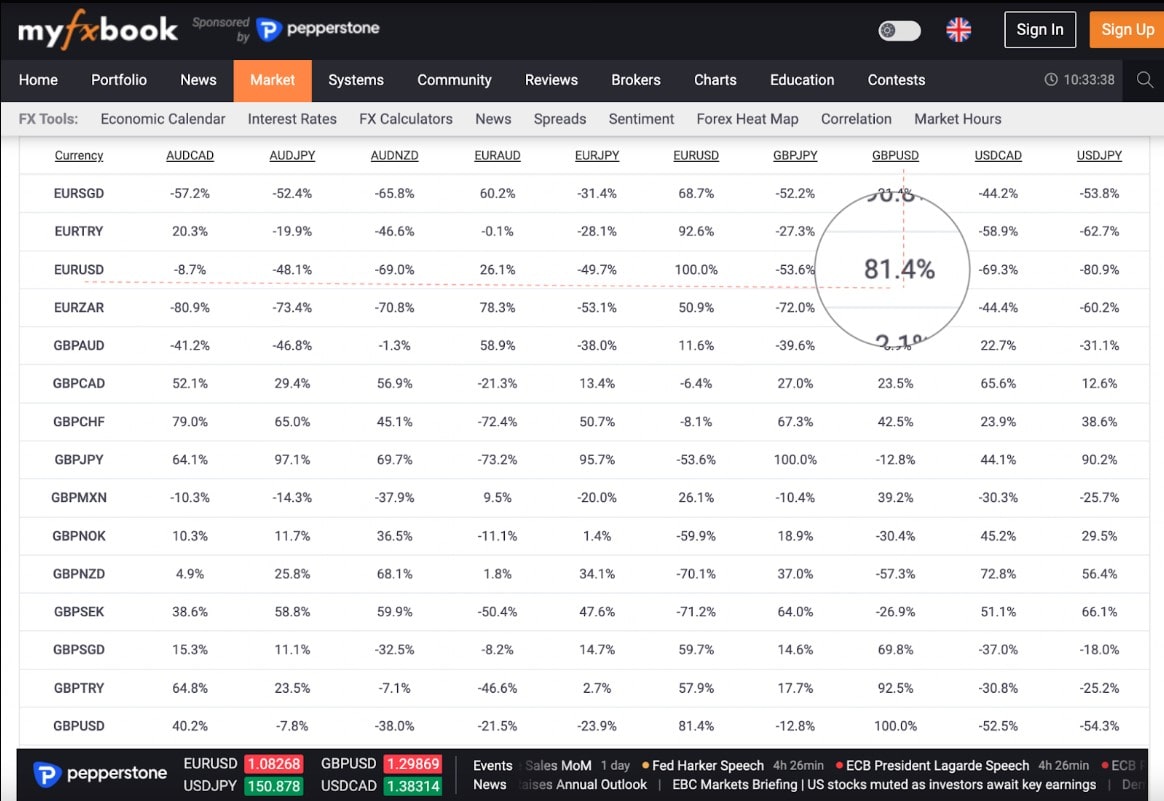
Consider using myfxbook to compare currency correlations:
How volatile is GBP/USD compared to other major currency pairs?
GBP/USD is known for its volatility, often more so than other major pairs like EUR/USD. This is due to the Pound's sensitivity to political events, economic data, and global market sentiment. During times of uncertainty, such as Brexit, GBP/USD can see dramatic price swings. Traders should be prepared for periods of higher volatility and use appropriate risk management strategies. The GBP/USD pair typically experiences an average daily pip movement of between 80-120 pips.
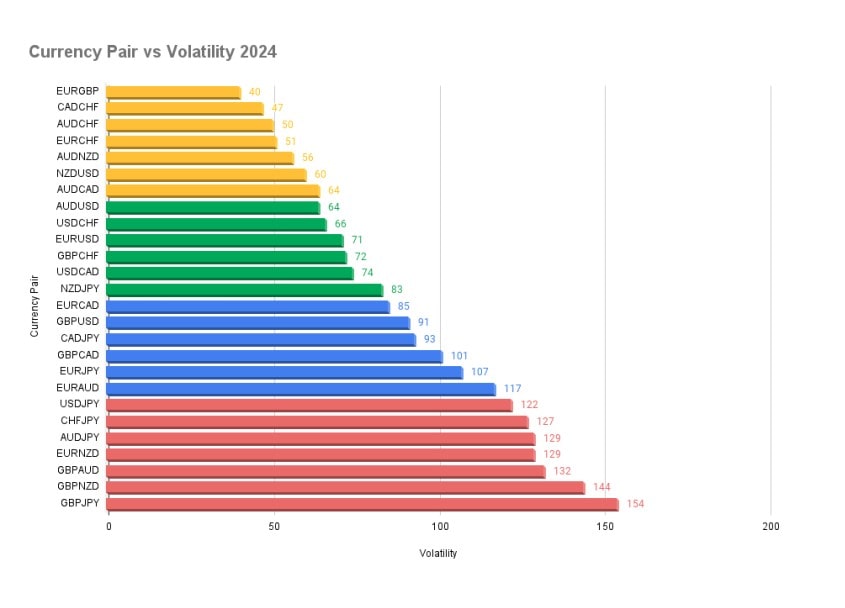
Source: forex-station.com
One indicator to consider tracking volatility is implied volatility. In currency trading, implied volatility refers to the market's expectation of how much the price of a currency pair might fluctuate in the future. It is derived from the prices of options on that currency pair and indicates the level of uncertainty or risk traders anticipate. In simple terms, higher implied volatility means traders expect bigger price swings (up or down) in the future, while lower implied volatility suggests expectations of smaller price movements.
What is the significance of GBP/USD chart patterns?
Using chart patterns effectively in GBP/USD trading involves understanding the pattern context, checking for confirmation signals, and managing risk through proper stop-loss and take-profit placements.
Reversal patterns: Reversal patterns like head and shoulders can help identify potential changes in direction.
Continuation patterns: Continuation patterns like flags can indicate that the current trend may persist, helping traders stay in the trend longer.
Breakouts: Recognising a breakout pattern (e.g., triangle or rectangle formations) can help traders enter the market when the price breaks through key resistance or support levels.
These patterns, when used in conjunction with other tools like support/resistance levels or indicators like ATR, can offer more precise entry and exit points.
How can I use economic calendars to time trades in GBP/USD?
Using an economic calendar is essential for timing trades in GBP/USD and can help track key events like interest rate decisions, inflation data, and employment reports, which can trigger significant price movements.
Why Wait for the Initial Move?
It's often better to wait for the initial move after an economic release rather than holding a position beforehand for a number of reasons:
Volatility and Uncertainty: Market reaction can be unpredictable, especially when the data release differs significantly from expectations. Holding a position before the release can lead to exposure to unexpected volatility.
Spread Widening: Around major events, brokers may widen spreads due to low liquidity, increasing trading costs. Waiting for the initial move can help avoid this.
False Moves: Markets often experience sharp, quick moves right after a release before settling into a clear direction. By waiting, the trend can be confirmed before entering.
Why the Market Prices in Data Beforehand
Sometimes, the market reacts before a release because traders anticipate the outcome, which is known as "pricing in" the data. For example:
Analysts Estimates: When consensus expectations are strong (e.g., a likely interest rate hike), traders may adjust positions early, leading to pre-release moves.
Leaked Data: Occasionally, early data releases or leaks can cause the market to react before the official announcement.
How can I avoid overtrading GBP/USD?
Overtrading is a common mistake among traders, especially beginners. To avoid overtrading:
Stick to a Plan: Trade based on a strategy and avoid entering trades out of boredom or frustration.
Limit the Number of Trades: Set a maximum number of trades per day or week to prevent excessive trading.
Wait for Clear Signals: Only enter trades when predetermined criteria is met, rather than reacting to every market movement.
What time frame should I use for GBP/USD trades?
The ideal time frame for trading GBP/USD depends on the trading style:
Scalpers: Use 1-5 minute charts for quick trades based on small price movements.
Day Traders: Focus on 15-minute to hourly charts, aiming to capitalise on intraday price swings.
Swing Traders: Use 4-hour to daily charts to capture larger moves over days or weeks.
For beginners, using longer time frames can be more manageable since they provide more time for careful analysis and decision-making. Experienced traders often use multiple time frames simultaneously to get a broader and more detailed perspective on market trends.
The material provided here has not been prepared in accordance with legal requirements designed to promote the independence of investment research and as such is considered to be a marketing communication. Whilst it is not subject to any prohibition on dealing ahead of the dissemination of investment research we will not seek to take any advantage before providing it to our clients.
Pepperstone doesn’t represent that the material provided here is accurate, current or complete, and therefore shouldn’t be relied upon as such. The information, whether from a third party or not, isn’t to be considered as a recommendation; or an offer to buy or sell; or the solicitation of an offer to buy or sell any security, financial product or instrument; or to participate in any particular trading strategy. It does not take into account readers’ financial situation or investment objectives. We advise any readers of this content to seek their own advice. Without the approval of Pepperstone, reproduction or redistribution of this information isn’t permitted.