Spread bets and CFDs are complex instruments and come with a high risk of losing money rapidly due to leverage. 73.7% of retail investor accounts lose money when trading spread bets and CFDs with this provider. You should consider whether you understand how spread bets and CFDs work, and whether you can afford to take the high risk of losing your money.
- English
- 中文版
Trader thoughts - The plays that are front of mind pre-US CPI

As an S&P 500 sub-sector, Financials are up 1% and remain one of the preferred plays at this juncture - notably Morgan Stanley is one chart I like, albeit the volume has been falling away on the positive days. Healthcare has been quite volatile, with Moderna getting slammed 5.7%, but the move of late has been breathtaking, while on the day Pfizer has rallied 4.8% to pick up the slack – trend buyers will be looking for levels to buy into weakness in Moderna.
Tech has underperformed as traders roll into value and cyclical names, where the DOW Transports closed +1.9% - In Europe, the EU Stoxx index hit new all-time highs, although the daily high-low range is almost non-existent.
Equity index volatility remains subdued where the S&P 500 futures have traded a 22-handle range on 910k contract, which is poor. Using the logic (today's high-low/prior days close) we see the percentage range in line with recent moves, but the 5-day average is now 0.49% and the lowest since December 2019. We have also seen just a 15-handle range in the S&P 500 cash, and a 194-point range in the Dow cash trade.
The 10-day realised volatility in the S&P 500 futures, which is what our US500 product is derived from to make a cash market for clients to trade, has dropped below 5% and eyeing a break of the 2 July lows of 4%. It’s amazing to think the VIX index is still at 16.7% when the volatility that’s realising is so low. The question is whether this is the calm before the storm?
They say “never short a dull market” – well, there is merit to this and since 2000 if one was to buy the S&P 500 when 10-day realised volatility fell below 5%, 5 days later the index was higher 56% of the time. As a trader who likes movement, I personally hope for vols to rise across asset class.
Let’s see if today's US CPI print mixes things up a bit, but with the market likely discounting a 40bp lift in core CPI in July (month on month), taking price pressures to a 4.3% YoY pace, we’d likely need a lift of 50bp (MoM), potentially 60bp, to really stir things up too greatly. Then we need to look at the components that made up inflation, and specifically, owner equivalent rents (OER) would be interesting here – when the macro world is still debating the duration of ‘transitory’, if OER pushes higher it will suggest inflation is sticking around for some time as it makes up some 30% of the CPI basket – a fact so many US corporates have hinted at of late.
The US bond market will be what other markets will key off when we see the CPI print, and a hot number will likely spill over into further selling of the ‘belly’ of the curve – i.e. 5-7-year US Treasuries, which have closed up 3bp a piece today. US banks remain a hedge against a move higher in bonds and rates and we can play this via the S&P 500 bank ETF (clients need to use MT5 here). The technical break out in US 10yr Treasuries is putting tailwinds behind the banks (and the USD), and I will be looking for 10s to possible push up to 1.50% but this will require real yields to move higher - a headwind for Gold.
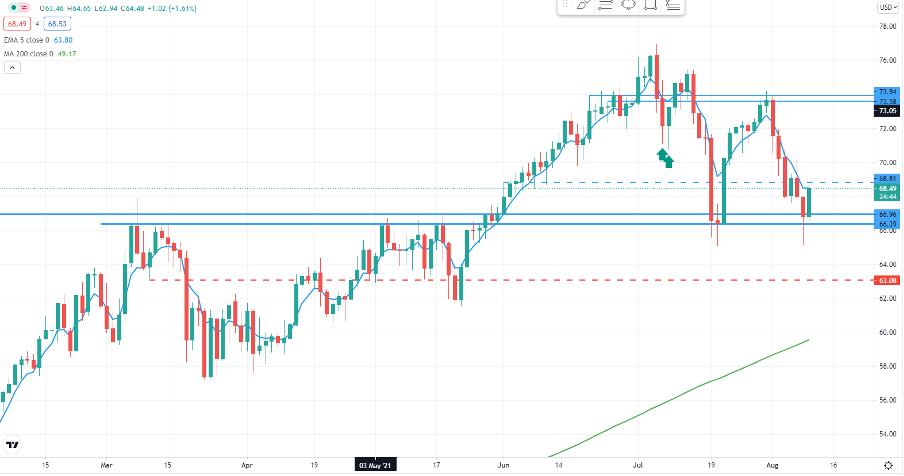
US CRUDE DAILY

(Source: Tradingview)
A 3% rally in crude into $68.29 has also been well traded and a double bottom is in play on the daily, although the neckline is someway off at $74.21. Support has held at $66.86/35 zone and the price has pushed to the 5-day EMA. So, more work is needed to see believe the recent liquidation is over, but the bulls will like that support this held. The fundamental reasoning for the crude move requires some exploration, but the EIA have upgraded its oil demand estimates for 2H21 and an attack on a Syrian ship used to transport Iranian oil have been touted.
One would imagine the move in crude has given bond yields a slight lift too, and reasoning why the CAD and NOK are the best performing major currencies on the day. USDCAD has printed a bearish outside day and needs monitoring for follow-through selling but take out the USD and the CHF and JPY have been the weaker plays in G10 FX, largely due to fair market sentiment - so CADJPY has been a good trade to be long, and the daily chart shows price breaking higher. – I like longs here for 89.50. Taking a high-level view, the CAD has been the best performing currency of 2021, with the GBP not too far behind. GBPCHF is one that has come up as a top 5 traded markets by clients, so it’s been given a really good run through London and US trade – how price reacts into 1.2800 could be interesting.
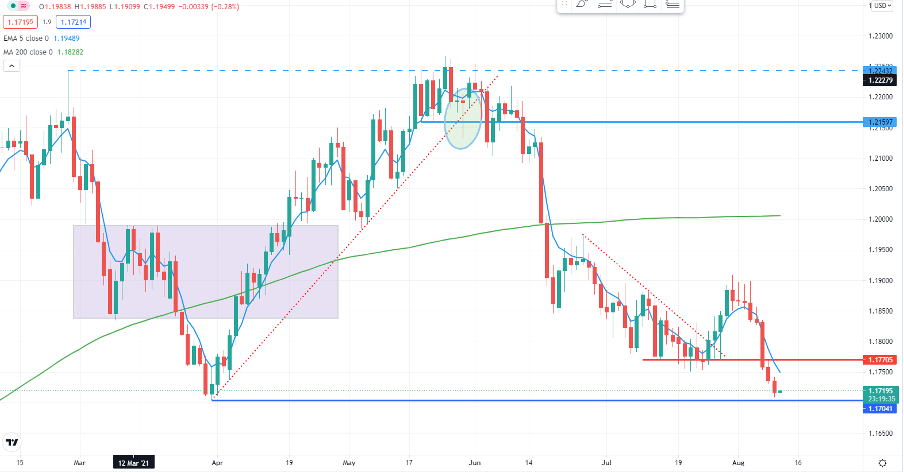
EURUSD daily

(Source: Tradingview)
The USD is up 0.1%, so not huge but we see EURUSD slipping further lower and starting to show better trending qualities as we eye the 31 March low of 1.1704. A solid US CPI print and this level should be taken out, with the DXY making a new high too. USDJPY is pushing strong resistance here at 110.58 and if it can squeeze through here, I’m looking for the figure to come into play, with the top of the I-cloud also a potential headwind for USD longs.
AUDUSD has found a solid bid of the lows of 0.7316 into 0.7349, where we sit now – Westpac consumer confidence is due at 10:30 AEST but shouldn’t move the dial too intently.
Not a lot of action in Gold, with clear indecision to do much after Monday’s volatility. Price trading a 1738 to 1717 range, although it’s been messy on an intra-day basis. Crypto getting a good run and notably ETH has a short-term consolidation feel – I like this as a momentum trade, so a push through 3200 should be on the radar and bring out the momo traders for 3600. This applies to BTC and a push through 45000 should attract new longs. Our clients remain steadfastly bullish, with 81% of all positions held long of ETH.
Related articles
Ready to trade?
It's quick and easy to get started. Apply in minutes with our simple application process.
The material provided here has not been prepared in accordance with legal requirements designed to promote the independence of investment research and as such is considered to be a marketing communication. Whilst it is not subject to any prohibition on dealing ahead of the dissemination of investment research we will not seek to take any advantage before providing it to our clients.
Pepperstone doesn’t represent that the material provided here is accurate, current or complete, and therefore shouldn’t be relied upon as such. The information, whether from a third party or not, isn’t to be considered as a recommendation; or an offer to buy or sell; or the solicitation of an offer to buy or sell any security, financial product or instrument; or to participate in any particular trading strategy. It does not take into account readers’ financial situation or investment objectives. We advise any readers of this content to seek their own advice. Without the approval of Pepperstone, reproduction or redistribution of this information isn’t permitted..