Spread bets and CFDs are complex instruments and come with a high risk of losing money rapidly due to leverage. 73.7% of retail investor accounts lose money when trading spread bets and CFDs with this provider. You should consider whether you understand how spread bets and CFDs work, and whether you can afford to take the high risk of losing your money.
- English
- 中文版
Wall St: Not Just A Magnificent Seven Story Anymore

Having rallied, broadly, in line with each other for much of 2023, the handful of equities in question – Apple, Amazon, Alphabet, Meta, Microsoft, Nvidia and Tesla – have performed in a far from uniform way since the turn of the year.
_mag_7_2024-02-07_18-18-59.jpg)
While Nvidia continues to benefit from the ever-increasing frenzy around AI, and Meta has performed strongly, boosted by blowout Q4 earnings, and the announcement of the firm’s first ever dividend payment, other names in this grouping have performed in a decidedly more ordinary manner.
Both Alphabet and Apple have failed to outperform the S&P 500 on a YTD basis, the former owing to significantly poorer than expected Q4 advertising revenue, and the latter amid a handful of broker downgrades, amid ongoing demand worries, particularly in China. The standout laggard, however, is Tesla, which stands as the worst performer in the S&P 500, trading over 25% lower YTD, amid a plethora of issues ranging from waning EV demand to long-running concerns over corporate governance.
Many, therefore, are beginning to wonder whether the ‘magnificent seven’ should be renamed the ‘super six’, ‘fab five’, ‘fantastic four’, or any other moderately cringeworthy moniker that could reasonably be used for a group of booming megacap equities – answers on a postcard, please!
On a more serious level, and keeping that grouping as a seven for now, it’s noteworthy how the tech behemoths haven’t outperformed the broader market to anywhere near the same degree as seen during 2023.

This hints at a broader theme, in that the equity rally seen so far in 2024 has been significantly more broad based than that which came last year. A simple look at the performance of various sectors this year evidences this well.
On the whole, that sector breakdown is largely what you would expect in the current macro environment – where the US economy looks set to stick the much-anticipated ‘soft landing’, and Fed policymakers have struck a relatively hawkish tone, pushing back on the idea of cuts in Q1, sparking a repricing of the USD OIS curve, and a kick higher in yields across the Treasury curve.
Naturally, financials should benefit from such an environment, while you’d also expect real estate and utilities to soften, as has occurred. In any case, it’s nice to get a long-overdue reminder that, despite recent form, the US equity market isn’t only about tech.
There are other signs that also point to a differing dynamic under the market’s surface, and better overall breadth. While there are many ways to measure such a concept, perhaps the simplest in any given index is to simply look at the proportion of constituents trading above a given moving average; I’ve used the 200-day MA here, simply due to its prowess in gauging longer-run momentum.
Clearly, the above shows the rally being relatively broad based, with well over 70% of S&P 500 members trading above said long-run average. Other indicators tell a similar story, including the advance-decline ratio, and the % of index members printing new all-time highs, with around 10-15% of index members having printed new 52-week highs on a daily basis since the middle of last month.
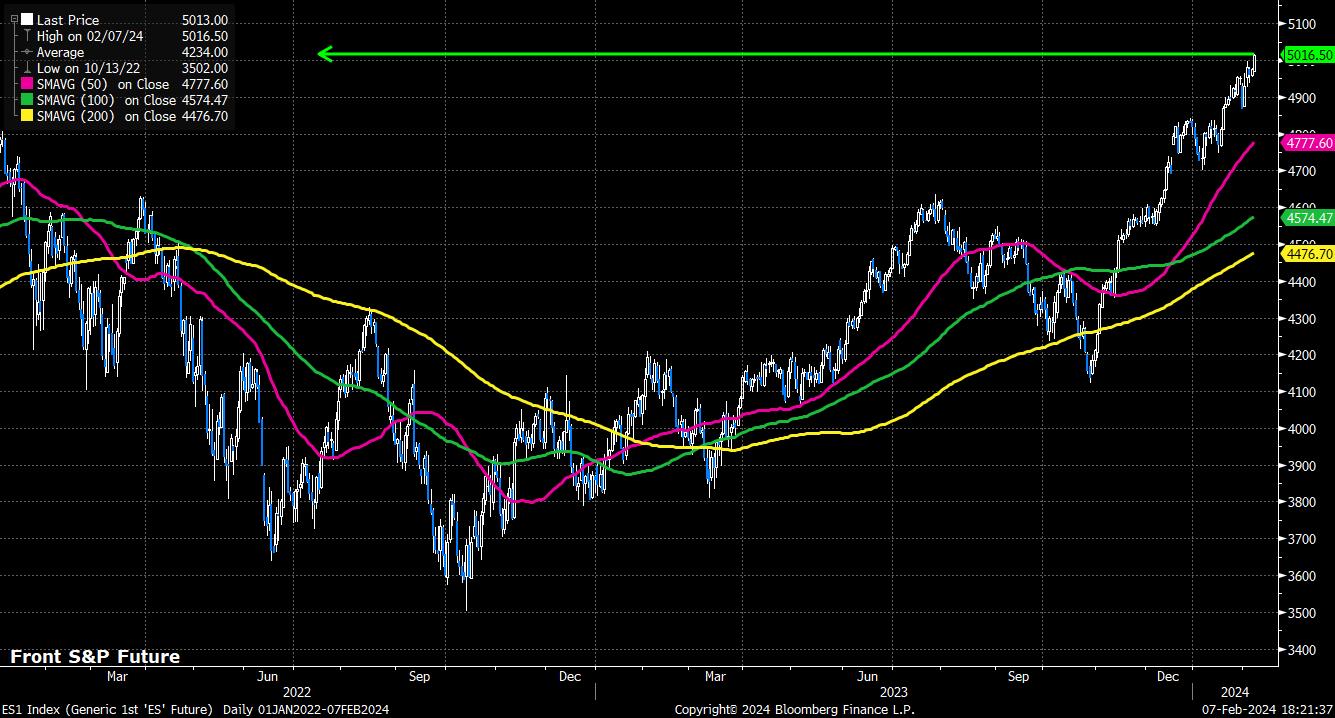
There is a case, however, to say that while all of the above is interesting, all one really needs to look at is price to gauge where the market may be heading. On that note, both the S&P 500 and Nasdaq 100 trade at fresh record highs, with the front S&P contract now trading north of the 5,000 mark for the first time ever. As has often been stated in these columns, there are few more bullish signs than a market printing fresh records.

Related articles
The material provided here has not been prepared in accordance with legal requirements designed to promote the independence of investment research and as such is considered to be a marketing communication. Whilst it is not subject to any prohibition on dealing ahead of the dissemination of investment research we will not seek to take any advantage before providing it to our clients.
Pepperstone doesn’t represent that the material provided here is accurate, current or complete, and therefore shouldn’t be relied upon as such. The information, whether from a third party or not, isn’t to be considered as a recommendation; or an offer to buy or sell; or the solicitation of an offer to buy or sell any security, financial product or instrument; or to participate in any particular trading strategy. It does not take into account readers’ financial situation or investment objectives. We advise any readers of this content to seek their own advice. Without the approval of Pepperstone, reproduction or redistribution of this information isn’t permitted..


