CFDs are complex instruments and come with a high risk of losing money rapidly due to leverage. 75.1% of retail investor accounts lose money when trading CFDs with this provider. You should consider whether you understand how CFDs work and whether you can afford to take the high risk of losing your money.
- English
- Italiano
- Español
- Français
New highs in US equities, but can we learn anything from the options markets?

For context, the S&P 500 closed +1.4%, the NAS100 +2.6%, Russell +0.5% and Dow +1.1%. Volumes were a touch on the light side, with turnover through the S&P 500 9% below the 30-day average, while 1.4m S&P500 futures contracts traded, although, consider it's August and summer holiday season.
We’ve seen value (as an investible factor) working well of late, and it’s a trade I like into September, as my last two notes have touched on, however, today belongs to tech and domestic cyclicals, with small rotations out of financials. The NAS100 looks good for new highs, with price finding good support at the 20-day MA, and holding Monday’s low and I’d be long here in small size, looking to trail the stop or even add on a break of the ATH – although it’s about how price reacts in blue sky territory that’s most important.
By way of sentiment, I continue to watch the cash VIX index, which sits 1.8 vols lower on the day and at 22.28% is grating ever closer to 20%. Our VIX price tracks VIX futures and at 26.15% is almost at the lowest levels since March. Staying in the volatility (vol) space, and apologies if you’re new to options but I thought I’d touch on something a little different that can offer really good insights into sentiment.
Upper pane – VIX index, lower – S&P500 1m call vol – 1m put vol
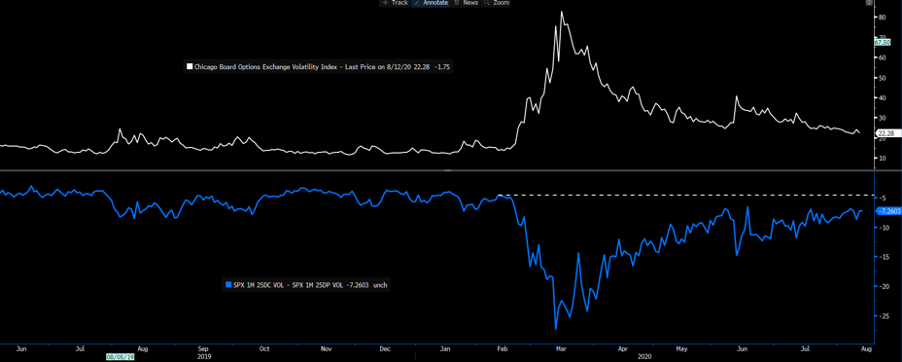
Source: Bloomberg
As we see above, S&P 500 1-month implied put volatility continues to come in relative to call volatility and there is now just a 7 vol differential between the two. This seems remarkable given this spread moved to a 27 in March, as everyone was buying puts, which pushed 1-month put implied volatility to a record high of 86%. We’re almost back to pre-Covid19 levels, as we are with the equity index.
When will funds start aggressively selling volatility?
We’re also not completely at the point where mutual funds and other buy-side players are so confident that we’re not going to see a re-run of the February volatility spike that they liberally start selling volatility to enhance returns on their equity positions. The trade that was incredibly popular pre-COVID were ‘collars’ – i.e. selling S&P 500 upside calls and collecting premium (as a portfolio enhancement) and simultaneously buying out-of-the-money puts, which at the time were dirt cheap – funds knew the Fed (and other central banks) had their back, so short volatility trades were all the rage. In late Feb as it was clear that economies were to be shutdown, years of short volatility structures were unwound in a heartbeat, and that ultimately why markets collapsed at the pace they did.
One way of measuring sentiment looking at this very trade is through the Credit Suisse Fear Index, which I guess is not widely looked at outside of options trader’s circle and is pretty technical. Here we see the S&P500 (orange) vs the CSFB fear index at 25.37. The idea here is if a fund wants to sell a 10% out of the money call and receive premium (if this settles in the money), then using that exact amount of premium, and given the cost for puts, the CSFB fear index looks at how far out of the money will I have to go to buy a put and protect my position for zero cost. The higher the CSFB fear index the greater the skew and the higher the demand for downside volatility meaning the strike on my put option gets pushed further away from the current index price.
So, in effect, if the S&&P500 is trading at 3380 and I sell a 3-month 10% OTM call at 3718 and receive premium, for zero cost I can, therefore, buy a put at 2523.
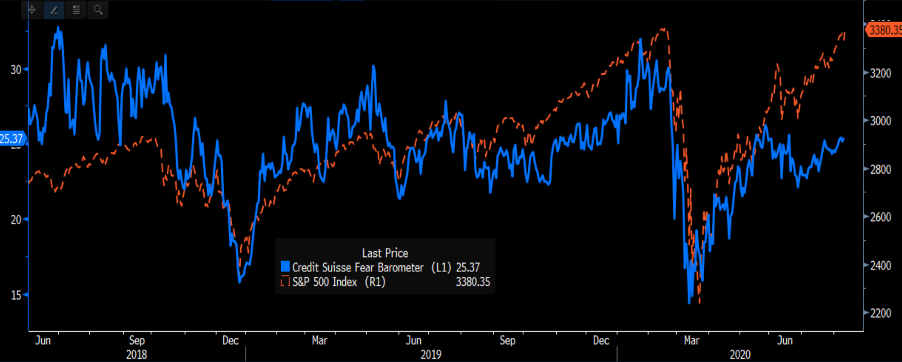
Source: Bloomberg
I think it can act as a good contrarian timing indicator too and it’s interesting to see divergence between price and the CSFB index, but then there are so many distortions in markets these days.
This collar strategy is the very essence of what influenced the sheer pace of the February drawdown, and I question if it is deployed again if the VIX trades sub-20% - it could have huge implications for markets if investment funds start selling equity volatility and there is no doubt the Fed wants them to do so.
Another options gauge that does the rounds is the CBoE put/call ratio. I’ve looked at the 5-day average which is not far off the lowest levels since 2011. The relative cost is one thing but when we’re looking at the absolute skew in activity, we can see its all call buying. Another indicator liberally used by contrarians, although I would not want to be shorting US equity markets on this in isolation.
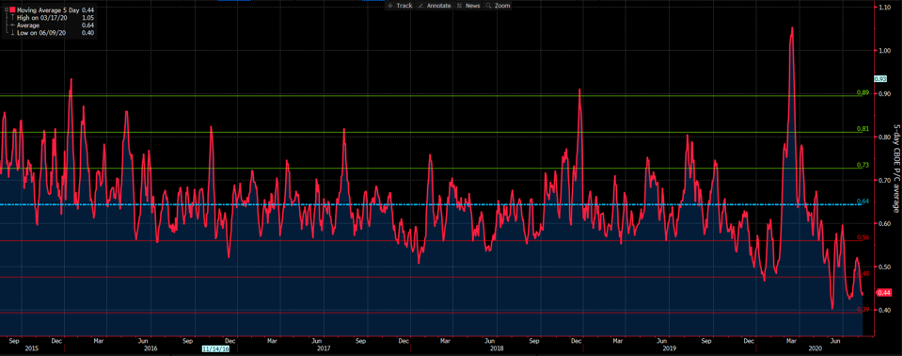
Source: Bloomberg
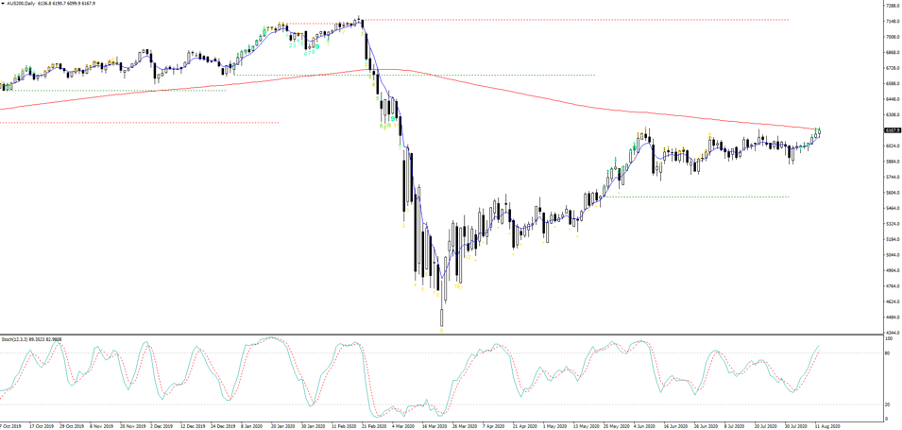
One equity market I am looking at closely today is the AUS200. Not just because we’re about to see earnings come in thick and fast and this could be a catalyst, but because we’re pushing the 200-day MA and June high of 6197 – do we fade into here? One to watch, but the index is already above the 61q.8% fibo of the Feb-March sell-off and a close through 6200 in the ST, could open up a move into 6405.
Related articles

Ready to trade?
It's quick and easy to get started. Apply in minutes with our simple application process.
The material provided here has not been prepared in accordance with legal requirements designed to promote the independence of investment research and as such is considered to be a marketing communication. Whilst it is not subject to any prohibition on dealing ahead of the dissemination of investment research we will not seek to take any advantage before providing it to our clients. Pepperstone doesn’t represent that the material provided here is accurate, current or complete, and therefore shouldn’t be relied upon as such. The information, whether from a third party or not, isn’t to be considered as a recommendation; or an offer to buy or sell; or the solicitation of an offer to buy or sell any security, financial product or instrument; or to participate in any particular trading strategy. It does not take into account readers’ financial situation or investment objectives. We advise any readers of this content to seek their own advice. Without the approval of Pepperstone, reproduction or redistribution of this information isn’t permitted.