CFDs are complex instruments and come with a high risk of losing money rapidly due to leverage. 75.1% of retail investor accounts lose money when trading CFDs with this provider. You should consider whether you understand how CFDs work and whether you can afford to take the high risk of losing your money.
- English
- Italiano
- Español
- Français
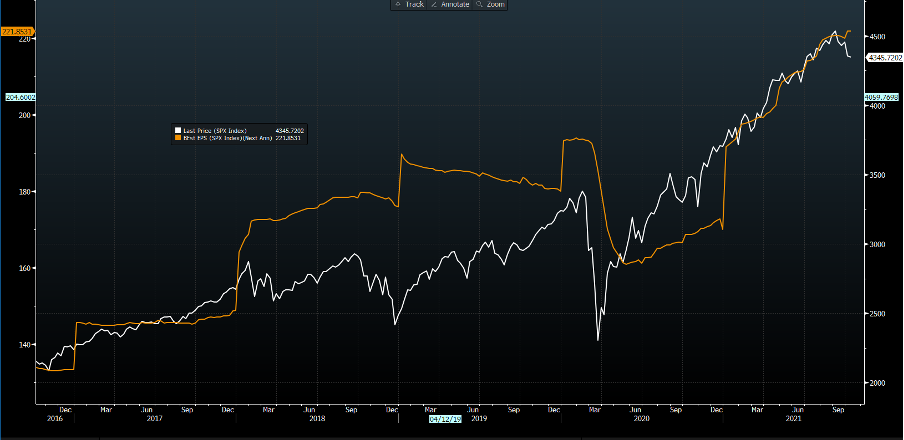
People say that equity markets are driven solely by liquidity and flow and I am sympathetic to that view. However, overlap the S&P 500 aggregated earnings expectations to the S&P 500 itself and we can see that earnings upgrades have been at the heart of equity returns.
White – US500, orange – consensus EPS expectations for 2022
(Source: Bloomberg - Past performance is not indicative of future performance)
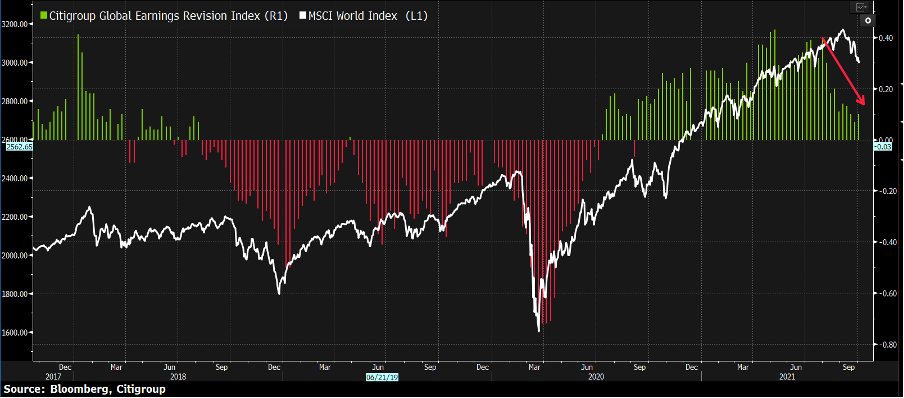
This is true of global markets too.
Citigroup’s global earnings revision vs the US500
(Source: Bloomberg - Past performance is not indicative of future performance)
Through Q3 we saw analysts lift earnings estimates by around 3% with a steady lift in expectations for sales too and this has reduced the various US indices valuations. For context, on the current earnings estimates the S&P 500 trades on 21.4x 2021 earnings, which is sharply lower from valuations seen at the beginning of the year, but still 13% above the long-term average.
When various measures of market volatility are elevated, such as we’re seeing now, the influence of valuation can play a more prominent role in the investment process. At the same time, bond yields are rising, amid supply-side inflation concerns and business inputs, such as raw materials, are rising at a rapid clip valuation, in turn, valuation needs to offer a sufficient cushion – in an environment where central banks are starting to normalise policy, if the market doesn’t feel fairly compensated for the risk and the opportunity cost, they will deploy capital into other better ‘value’ equity markets, or even re-weight portfolios to cash.
Given the macro headwinds, this earning season matters whether - so, whether trading individual equities or the US500, US30, US2000 or NAS100, earnings should throw up some compelling trading opportunities. And, if equity index volatility picks up then it will spill over into FX and commodity markets. If the VIX can push back to 25% then the USD will attract fresh buyers.
Earnings - What’s expected?
As we look towards the Q3 reports, the market expects 27% EPS growth in Q3 (year-on-year), which is the third-fastest pace of growth since 2010, but a sharp decline from the change seen in Q2 of 92%. The big percentage change in earnings growth will be seen in the materials (89%) and industrials (+68%) sectors . Sales are expected to rise around 15%.
Perhaps the big issue for traders is the level of beats/misses to the expectations. In Q2 86% of companies beat on EPS expectations, where the average beat was 16%. On sales, 83% beat expectations by an average of 4.6%. With analysts’ estimates always coming in low ball, the market may mark down stocks and the various US indices may struggle if the EPS beat rate is below 78% and if the average beat is below 10%.
Setting the scene
In the lead up to earnings, 56 S&P 500 companies have issued positive guidance vs 47 issuing negative guidance. While the positive/negative ratio is lower than Q2, this is the fifth straight quarter where the number of companies guiding to better results is higher than negative. Digging deeper we can already see that one of the themes of companies pre-guiding was around the impact of supply chains. Those companies (predominantly in the industrial and consumer names) that have discussed supply chains have seen share prices negatively impacted.
The core focal points that matter most
Supply chains are the big focal points both for stock traders and macro watchers, and commentary from CEO’s around how bottlenecks are affecting margins, and how quickly they see it taking to normalise, could have a big impact on both earnings and economic expectations too – this is the rare case where micro feeds the macro.
Wages pressures - On the point of margins, another key area to focus on is labour costs – we’re seeing rising wage pressures in several data points. Rising wages negatively impact margins, but it also has an impact on the perception of inflation, which of course is the big macro focal point at present – any commentary about wage pressures should resonate with investors.
Crude moves – With WTI crude eyeing $80 and Brent now firmly above $80, will we hear talk of increased investment to pump out heightened levels of crude? With OPEC maintaining the previously agreed output increase (at 400,000 b/d), if US listed producers look like they’ll deploy cash flow towards drilling activities, resulting in increased output, it could have big implications on the crude price. Any commentary on the crude outlook could move markets too.
Stocks to watch
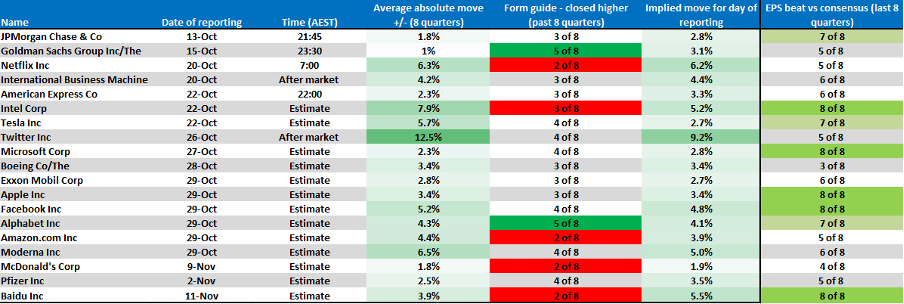
The marquee names will see the lion’s share of client flow. Here we see the form guide around earnings, historical moves on the day of earnings and what is implied. Any with ‘estimate’ is because the date hasn’t been confirmed but Bloomberg takes prior reporting dates into consideration, among other factors – do check your reporting calendar nearer the time.
Many of these marquee names can be traded on MT4 as well as MT5 now.
(Source: Pepperstone - Past performance is not indicative of future performance)
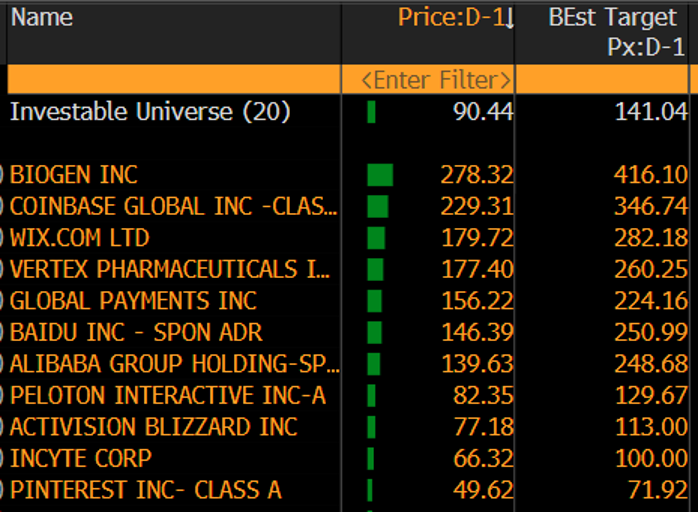
Trading cheap? Scanning for stocks trading 30% or more below consensus 12-month price target
(Source: Bloomberg - Past performance is not indicative of future performance)
High volatility stocks – scanning for stocks with the highest 30-day realised volatility. Here we’re looking at which are the most volatility going into earnings.
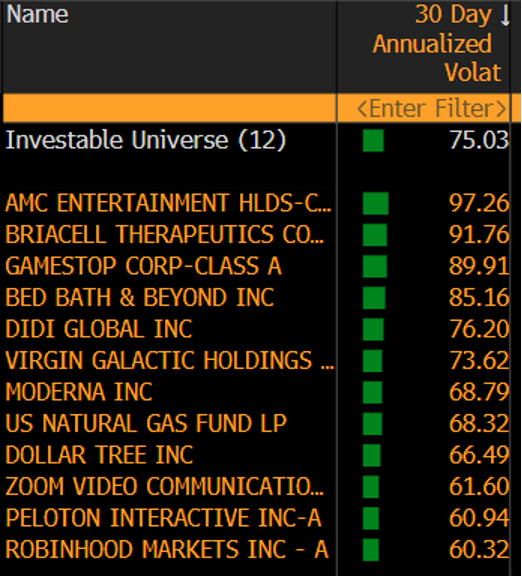
(Source: Bloomberg - Past performance is not indicative of future performance)
Most shorted – scanning for stocks with the highest short interest as a percentage of free float. If earnings are better, we could see some oversized moves as funds buy-back shorts.
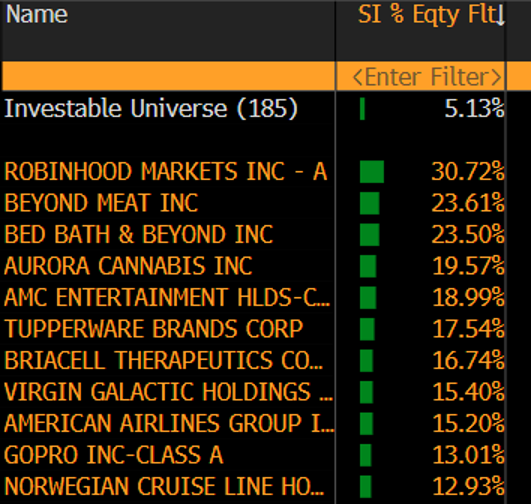
(Source: Bloomberg - Past performance is not indicative of future performance)
We’ll be updating earnings as we go, but this could throw up some great opportunities and you can trade your strategy either long or short here at Pepperstone.
Related articles
Ready to trade?
It's quick and easy to get started. Apply in minutes with our simple application process.
The material provided here has not been prepared in accordance with legal requirements designed to promote the independence of investment research and as such is considered to be a marketing communication. Whilst it is not subject to any prohibition on dealing ahead of the dissemination of investment research we will not seek to take any advantage before providing it to our clients. Pepperstone doesn’t represent that the material provided here is accurate, current or complete, and therefore shouldn’t be relied upon as such. The information, whether from a third party or not, isn’t to be considered as a recommendation; or an offer to buy or sell; or the solicitation of an offer to buy or sell any security, financial product or instrument; or to participate in any particular trading strategy. It does not take into account readers’ financial situation or investment objectives. We advise any readers of this content to seek their own advice. Without the approval of Pepperstone, reproduction or redistribution of this information isn’t permitted.


