Spread bets and CFDs are complex instruments and come with a high risk of losing money rapidly due to leverage. 73.7% of retail investor accounts lose money when trading spread bets and CFDs with this provider. You should consider whether you understand how spread bets and CFDs work, and whether you can afford to take the high risk of losing your money.
- English (UK)
Rates have been on a tear of late, particularly so towards the long end of the curve. The US 10-year is printing just under 1.45% at the time of writing. Putting this move in context, the median forecast in a recent Bloomberg survey was for 10-year Treasury yields to reach 1.45% in the fourth quarter - we’ve got there a lot sooner. Given the levels and speed at which yields are moving it seems like a good time to discuss the dynamics of a rate scare and how one can position for it.
Nominal yields over the past few months were being driven primarily via breakevens (inflation expectations rising), due to higher commodity prices, stimulus/pent up demand, however, now breakevens have begun to roll over slightly and the driver now is real yields which strips out the effects of inflation, providing a purer signal on the growth outlook. The important distinction for markets to make, is what is the source of that increase – is it growth or central bank policy driven? Personally, I believe it’s mainly growth driven, but the market is beginning to price in a faster taper of QE as well as an earlier lift-off in rate hikes. I think we could see a potential taper at the end of 2021/early 2022. The rate side of the equation is interesting as the Fed dot plot indicates no rate hikes through the end of 2023. The reason why I say yields are being driven partly by expectations of a more hawkish central bank policy, is because of what the money market is doing. Fed fund futures are essentially saying we’ll see our first 25 bps rate hike in March 2023, while Eurodollar futures are even earlier – December 2022. This despite, Jerome Powell reiterating to keep rates near zero until full employment and inflation rises to 2% and moderately exceeds 2% for “some time”. Additionally, he said it could take more than three years to hit that 2% average inflation target.
One has to wonder how much higher rates can go from here for 3 reasons – 1) Will it cause tighter financial conditions (biggest concern for Fed), 2) Debt sustainability from higher rates, causing the Fed to take action either through more QE or YCC 3) Foreign investors may begin buying up US bonds due to higher currency-hedged returns, particularly Japanese bond investors. Powell, effectively gave bond shorts the go ahead yesterday as he showed his lack of concern by the recent rise in yields - stating it reflected a more optimistic US economic outlook. Jim Bianco of Bianco Research shared an interesting chart showing economic forecasts for US 2021 GDP is looking really hot – close to 5%. That’s close to China type growth levels.
Source: Jim Bianco/Bianco Research
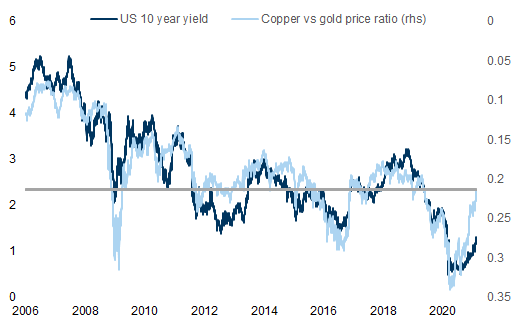
Now that we’ve spoken about the dynamics of yields it’s time to assess how to position for a potential rates scare. Gold and USDJPY would be the most sensitive to a fast rise in rates. The trade would be short gold and long USDJPY. The other instruments which are affected by rates and offer traders alternative strategies would be utilities, NASDAQ100, cyclicals like materials, industrials and financials as they benefit from yield curve steepening, Russel 2000, FTSE 250 and DAX30. So you could create a basket for shorts – gold, Nasdaq100, utilities and long – FTSE250, DAX30, Russel 2000, materials, financial, industrials and USDJPY. The dollar could also be a good option, given it could benefit from both a real rate rise as well as a safe haven bid from an equity sell-off caused by higher rates. Goldman Sachs produced an interesting chart (which I’ve shared below) illustrating that real yields could move much higher, closer to -0.1% (almost a 70bps increase) based on the copper gold ratio. This to me shows that we have to plan and be thinking about what we would do in a swift move higher in rates.

Source: Goldman Sachs
Related articles
Ready to trade?
It's quick and easy to get started. Apply in minutes with our online application process.
The material provided here has not been prepared in accordance with legal requirements designed to promote the independence of investment research and as such is considered to be a marketing communication. Whilst it is not subject to any prohibition on dealing ahead of the dissemination of investment research we will not seek to take any advantage before providing it to our clients. Pepperstone doesn’t represent that the material provided here is accurate, current or complete, and therefore shouldn’t be relied upon as such. The information, whether from a third party or not, isn’t to be considered as a recommendation; or an offer to buy or sell; or the solicitation of an offer to buy or sell any security, financial product or instrument; or to participate in any particular trading strategy. It does not take into account readers’ financial situation or investment objectives. We advise any readers of this content to seek their own advice. Without the approval of Pepperstone, reproduction or redistribution of this information isn’t permitted.
.jpg)

