Spread bets and CFDs are complex instruments and come with a high risk of losing money rapidly due to leverage. 73.7% of retail investor accounts lose money when trading spread bets and CFDs with this provider. You should consider whether you understand how spread bets and CFDs work, and whether you can afford to take the high risk of losing your money.
- English (UK)
One strongly suspects any rebalancing flow would have played out by now. With this in mind, it's worth flagging a number of technical set-ups that are getting real interest and I'm sure many will be keen to trade.
As always, levels are one aspect, but what's so much more important is how price behaves around these levels and it's from here that we assess and trade the flow of capital – this is the crux of technical analysis in my opinion. The aggregation of flow into one roadmap offering a probability of where price may head over a timeframe. Probability being key, as everything we do is aimed at understanding our risk to reward trade-off and setting position sizing accordingly.
In the equity world, the US500 is eyeing new all-time highs, where a closing break of 3980 takes the index into 4060 – the rising trend resistance. We’ve seen a Doji candle on the daily, which suggests some indecision, but on the current set-up I’m happy to hold longs and would trim on a break of 3853 – the swing low from 25 March. Tier 1 US Economic data will hold premise this week, but we also get US reporting season rolling in next week, and that will likely prove to be a bullish driver.
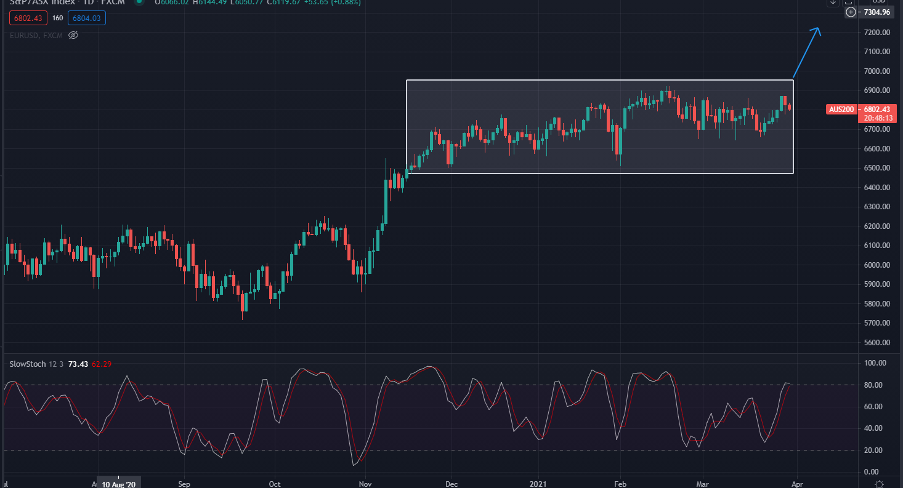
(AUS200 daily)

(Source: Bloomberg)
The GER40 sits at an all-time high and looks well supported – again, happy to hold longs here for now and see a limited reward in being short. The AUS200 has been trading a range of 6900 to 6500 since mid-November (92 bars), and at current levels, we’re at the 80th percentile of that range. A closing break of 6900 would be very powerful, although we’re in need of a new catalyst.
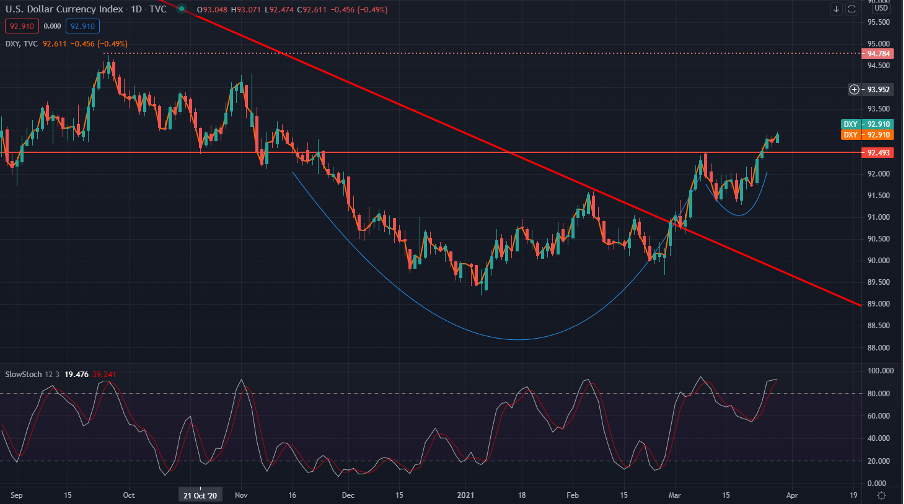
(USDX daily)

(Source: Bloomberg)
In the FX world, the USD has pushed to the highest levels since late November and we see the USDX pushing 93 – watch EURUSD here as a closing break of 1.1762 would propel the USD index highs. The support in EURUSD best seen in a timeframe of 4-hour and lower. Take the chart out and we see the obvious target for a downside break is the November lows of 1.1602. Keep an eye on the 5-year US Treasury - a push higher above 90bp would keep the USD momentum going.
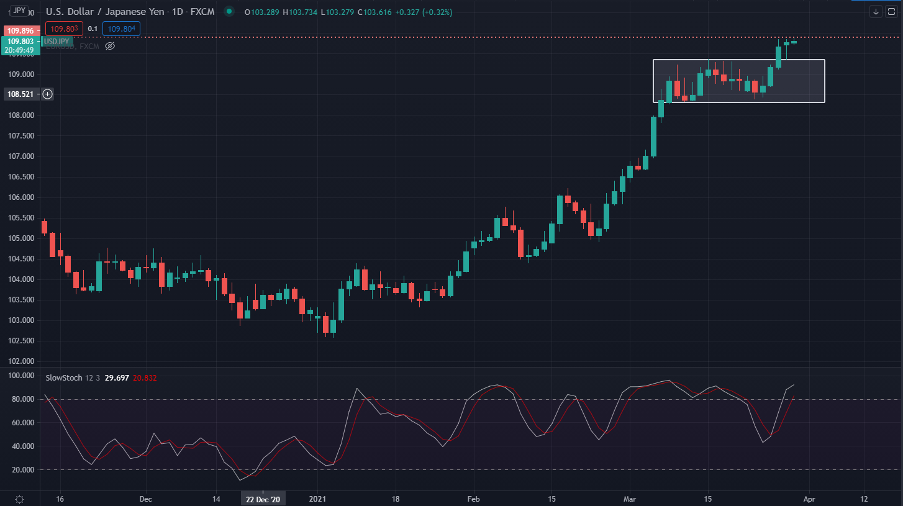
(USDJPY DAILY)

(Source: Bloomberg)
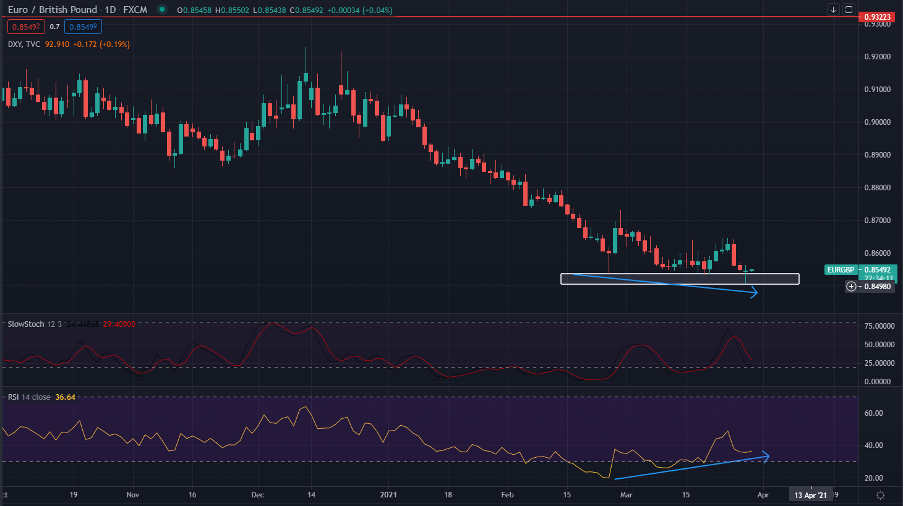
USDJPY is also feeding off the moves in US bond yields – higher bond yields tell us that the cost of capital rising but it suggests the USD has moved into a different realm as an investment destination. USDJPY had a backtest of the breakout zone yesterday, which confirmed 109.28 as now support and the pair is eyeing a break of the June 2020 highs – so, big levels being tested and USDJPY is a core focus ahead of US payrolls. USDCHF is also in the mix, although it is a mirror image of EURUSD. EURGBP sits on strong support, with bids seen between 0.8535/20 – the GBP bulls need this to clear to mitigate bullish divergence – if this closes to the downside then EURGBP shorts take this to 0.8300 over time in my opinion.
(EURGBP daily)

(Source: Bloomberg)
USDCNH has broken out above the 9 March swing high. In my mind, this is key behind the broad USD move. If this keeps heading high, backed by higher US bond yields, then the USD stays bid.
The combination of higher USD and bond yields is a toxic mix for gold and while we see minor support at 1699 (the 12 March low) the obvious level to watch here is 1676. Hard to see much upside unless the USD changes the trend.
Ready to trade?
It's quick and easy to get started. Apply in minutes with our online application process.
The material provided here has not been prepared in accordance with legal requirements designed to promote the independence of investment research and as such is considered to be a marketing communication. Whilst it is not subject to any prohibition on dealing ahead of the dissemination of investment research we will not seek to take any advantage before providing it to our clients. Pepperstone doesn’t represent that the material provided here is accurate, current or complete, and therefore shouldn’t be relied upon as such. The information, whether from a third party or not, isn’t to be considered as a recommendation; or an offer to buy or sell; or the solicitation of an offer to buy or sell any security, financial product or instrument; or to participate in any particular trading strategy. It does not take into account readers’ financial situation or investment objectives. We advise any readers of this content to seek their own advice. Without the approval of Pepperstone, reproduction or redistribution of this information isn’t permitted.

