What is the Relative Strength Index (RSI) and how does it work?
RSI is a popular momentum indicator used in trading. Understanding RSI can help traders make informed decisions, spot trend reversals, and manage risk. This guide covers the fundamentals and strategies for using RSI effectively.
RSI is a momentum oscillator that measures the speed and change of price movements in a financial asset. Developed by J. Welles Wilder in 1978, it ranges between 0 and 100, and is typically used to identify overbought or oversold conditions.
How is RSI Calculated?
RSI is calculated using a relatively simple formula, but most trading platforms like Pepperstone’s will automate the calculations.
Here’s the breakdown:
RSI = 100 - (100 ÷ (1 + RS))
Where:
- RS = Average Gain ÷ Average Loss
- For each day, calculate the difference between the closing price of the current day and the previous day.
- If the closing price is higher than the previous day, it’s a gain.
- If the closing price is lower than the previous day, it’s a loss.
The standard period used in RSI calculations is 14. For example, if a daily chart is being analysed, the RSI would look at the past 14 days to determine the relative strength or weakness of the asset over that time frame.
What are the standard RSI levels for identifying overbought and oversold conditions?
In general, RSI values are interpreted as follows:
Overbought: RSI above 70. When the RSI crosses this level, the asset may be considered overbought, signalling a potential reversal or pullback in price.
Oversold: RSI below 30. When the RSI falls below this level, it suggests the asset may be oversold, potentially signalling a reversal to the upside.
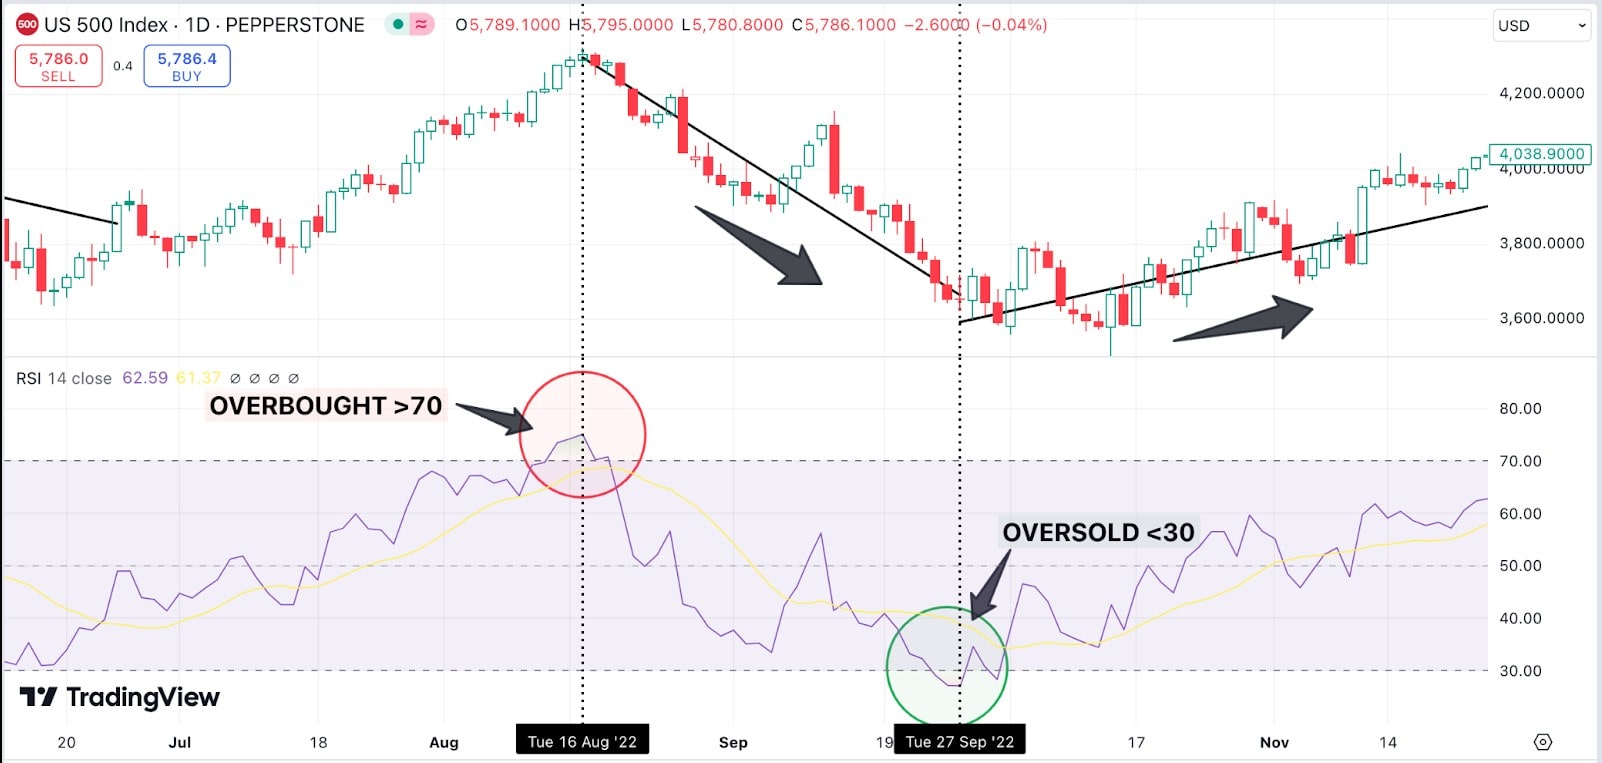
These levels are not set in stone, and some traders may adjust them to fit a particular trading style or the specific market conditions. For example, in highly volatile markets, some traders may use 80 as the overbought level and 20 for oversold conditions.
How can I use RSI to spot potential trend reversals in CFD trading?
RSI is particularly effective in spotting potential trend reversals. When an asset’s price trends strongly in one direction, but RSI starts moving in the opposite direction (known as divergence), it can signal that the trend is losing momentum and may reverse.
Bullish Divergence: This occurs when the price of the asset is trending lower, but the RSI is trending higher. This suggests that bearish momentum is weakening and a potential reversal to the upside could occur.
Bearish Divergence: This occurs when the asset’s price is trending higher, but the RSI is trending lower. This indicates that the bullish trend is weakening and a potential reversal to the downside might be on the horizon.
Here are two examples of bullish and bearish divergence using RSI for the US500 (S&P 500) index:
Bullish Divergence: US500 – February 2020 to March 2020
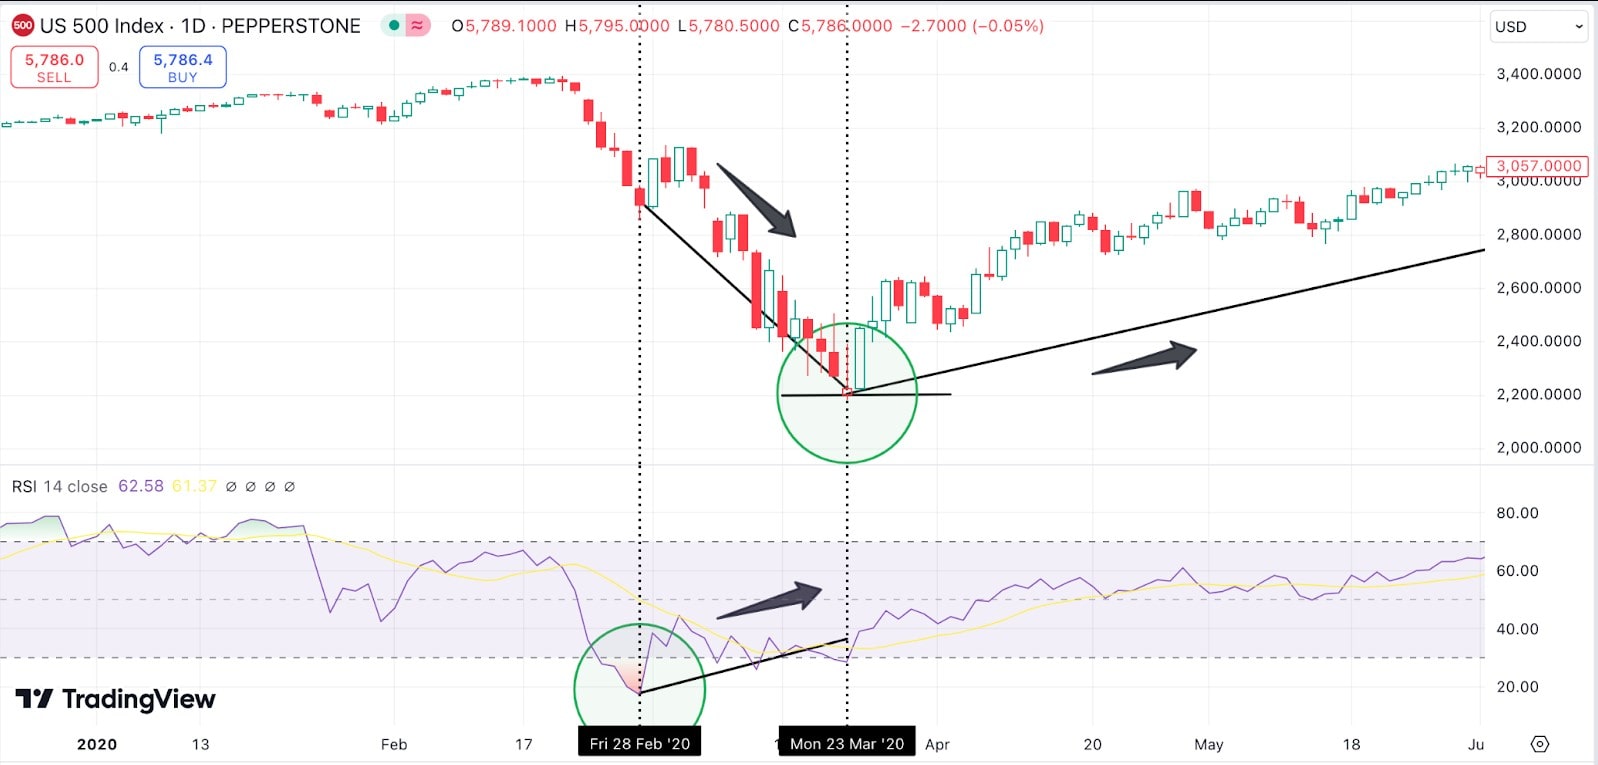
Price: During the COVID-19 market crash, the S&P 500 dropped sharply from 3,390 in February 2020 to a low of around 2,191 by mid-March.
RSI: The RSI dropped below 30 in late February, indicating the market was oversold.
Price Action: The S&P 500 made a lower low in mid-March (around 2,191). However, the RSI started trending higher even as prices continued to fall, suggesting the selling pressure was losing strength.
Result: This bullish divergence indicated a possible reversal. After this signal, the S&P 500 began a strong recovery, reaching new all-time highs later in 2020, climbing above 3,500 by September.
Bearish Divergence: US500 – November 2021 to January 2022
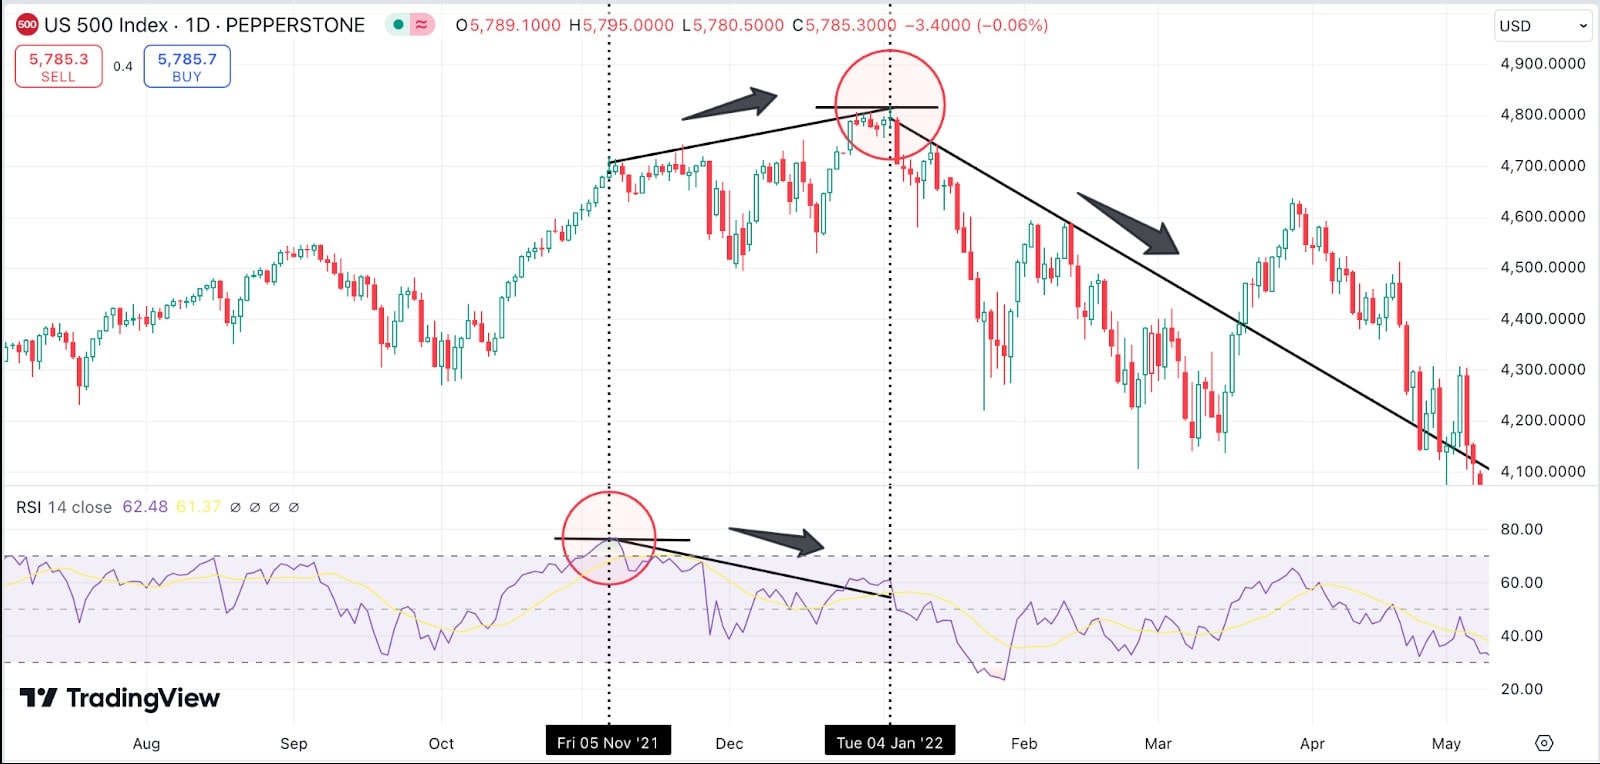
Price: The S&P 500 reached an all-time high of 4,818 in early January 2022, after rising from 4,700 in November 2021.
RSI: The RSI reached overbought levels (around 75) in November but began to fall by January.
Price Action: The S&P 500 made a higher high in January 2022 at 4,818.
RSI Action: However, the RSI made a lower high, showing that buying momentum was weakening.
Result: This bearish divergence signalled a potential market reversal. The S&P 500 subsequently declined, falling below 4,200 by February and continuing to drop throughout 2022, reflecting the early stages of a broader market correction.
These examples show how RSI divergence can be used to identify potential trend reversals in the US500, with bullish divergence signalling a rebound and bearish divergence warning of a potential decline.
What are the best time frames to use when analysing RSI for CFDs?
The best time frame for analysing RSI largely depends on trading style. For CFD traders, popular time frames include:
Short-Term (5-15 minutes): If day trading or scalping, RSI on shorter time frames can help capitalise on quick market movements. However, be cautious as RSI on short-term charts can be more prone to false signals.
Medium-Term (Hourly to Daily): Many CFD traders prefer the hourly or 4-hour chart for RSI analysis. This gives a broader view of price action without the excessive noise of shorter time frames.
Long-Term (Daily or Weekly): For swing traders and those holding CFD positions for several days or weeks, using RSI on daily or weekly charts can help you capture larger trends.
What are some effective RSI trading strategies for CFDs?
Here are a few effective RSI-based strategies for CFD traders:
RSI Trend Reversals: Look for overbought or oversold conditions (above 70 or below 30) and wait for RSI to move back toward the midline (50). This could indicate a potential reversal.
RSI Divergence Trading: As discussed earlier, RSI divergence between price action and the indicator is a reliable strategy for catching reversals.
RSI and Moving Averages: Combine RSI with a moving average (like a 50-day simple moving average) to confirm trends. When RSI aligns with a moving average crossover, it could strengthen the signal.
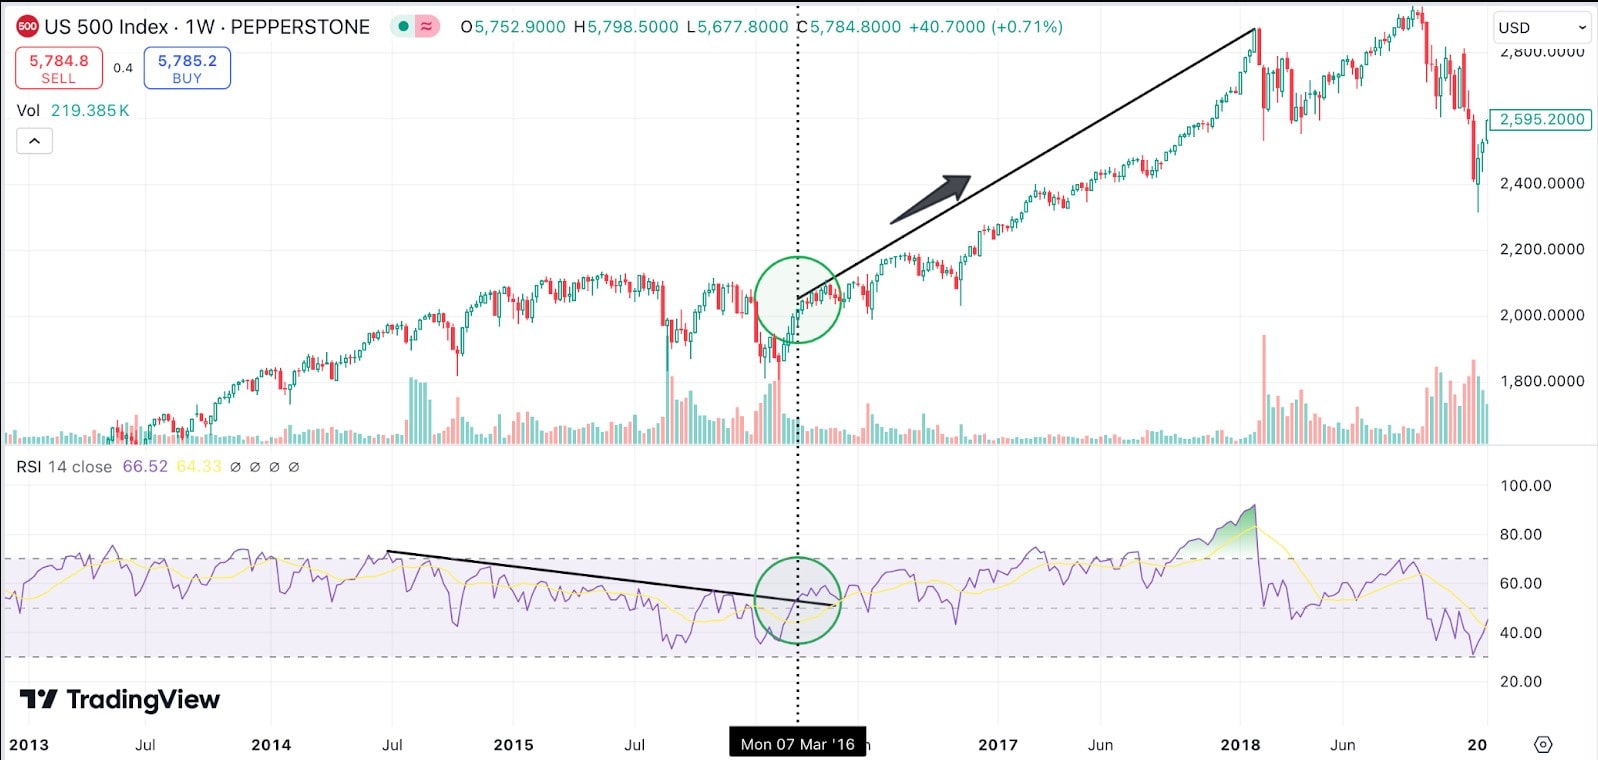
RSI Trendline Breaks: Draw trendlines on the RSI itself. If the RSI breaks a trendline, it could confirm a trend reversal or continuation (see chart below)
How does RSI compare to other momentum indicators like MACD or Stochastic Oscillator for CFDs?
RSI, MACD (Moving Average Convergence Divergence), and the Stochastic Oscillator are all momentum indicators, but they function differently:
MACD: Compares two moving averages (typically 12-day and 26-day EMAs) to spot changes in momentum. MACD also includes a histogram to show the distance between the moving averages, making it effective for spotting trend strength and reversals.
Stochastic Oscillator: Similar to RSI, but focuses on the relationship between a closing price and its price range over a specific period. Stochastic values range between 0 and 100, with levels above 80 indicating overbought conditions and below 20 indicating oversold conditions (see chart below)
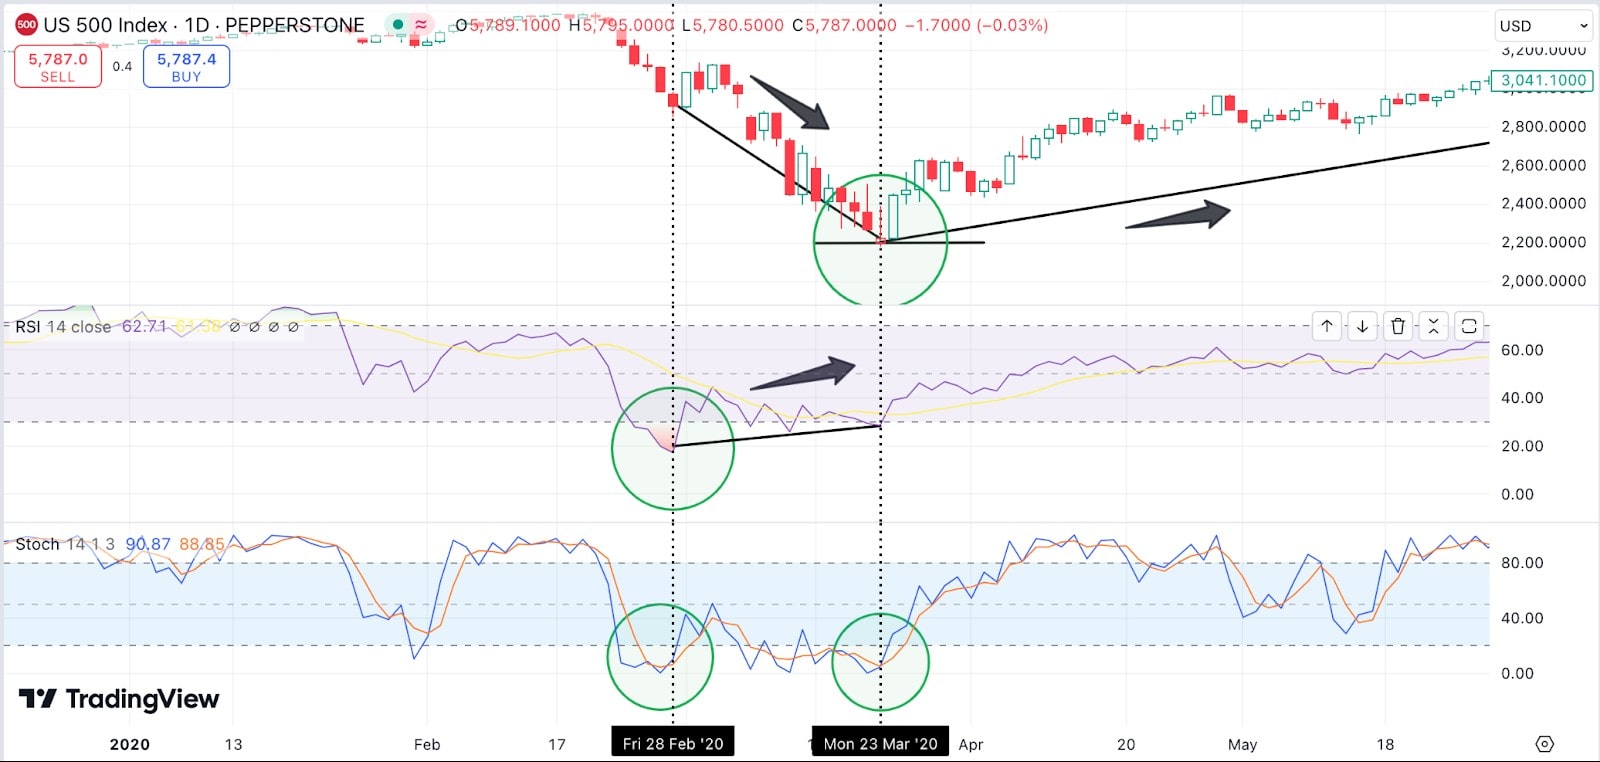
RSI is often favoured for its simplicity and reliability, while MACD provides more insight into trend strength. Stochastic Oscillator can be more sensitive, making it ideal for catching quick price movements in ranging markets.
Can RSI be used effectively in both trending and ranging CFD markets?
RSI can be effective in both trending and ranging markets, but the approach differs slightly:
Trending Markets: In strong trending markets, RSI can remain overbought or oversold for extended periods. Instead of looking for reversals, use RSI to confirm the strength of the trend. For example, in an uptrend, RSI staying above 50 may signal that the trend has strength, even if it's overbought.
Ranging Markets: In ranging markets, RSI is good for spotting reversals. As prices oscillate within a range, RSI will often move between overbought and oversold levels.
What are the risks of relying too much on RSI in CFD trading?
While RSI is a valuable tool, relying on it too much - especially in highly leveraged CFD trades - can be risky. Leveraged trades amplify both gains and losses, and using RSI alone can lead to false signals, particularly in volatile markets.
For example, in strong trends, RSI can stay overbought or oversold for extended periods, leading traders to mistakenly assume a reversal is imminent. In such cases, traders might exit positions prematurely or enter trades too early, only to see the trend continue against them.
To mitigate these risks, combine RSI with other indicators, such as moving averages or trend lines, and always apply sound risk management principles like setting stop-loss levels.
How Do I Adjust RSI Settings to Fit My Trading Style or Specific CFD Instruments?
The default RSI setting is 14 periods, but it can be adjusted based on trading style or the CFD instrument being traded:
Shorter Time Frames (Scalping/Day Trading): For faster-moving markets or short-term trades, a shorter RSI period (e.g., 7 or 9) can make the indicator more sensitive to price changes, providing more signals.
Longer Time Frames (Swing Trading): For longer-term trades, a longer period (e.g., 20 or 25) can be used, which will smooth out RSI readings and help avoid false signals.
In more volatile CFD instruments, like commodities, adjusting the RSI period can reduce noise and make the indicator more reliable.
How Do RSI False Signals Occur in CFD Trading, and How Can I Avoid Them?
RSI false signals occur when the indicator suggests a reversal or trend continuation, but the market does not follow through. These false signals often happen in trending markets where RSI stays overbought or oversold for extended periods.
To avoid false signals, it’s important to use RSI in conjunction with other technical tools and to wait for confirmation before entering a trade. For example, instead of acting on RSI alone, wait for the price to break a key support or resistance level before executing a trade.
.jpg)
A false RSI signal occurred with Tesla Inc. (TSLA) in July 2020. For a 3 week period the RSI stayed above 70 with the price around $90 indicating significantly overbought conditions. Typically, such a high RSI suggests an imminent price reversal or pullback. But Tesla's stock price continued to rise hitting around $160 on August 31, 2020. The expected downturn didn’t happen, proving the RSI signal false. This false signal occurred because the overall market sentiment was extremely bullish, driven by Tesla’s stock split, increased investor interest, and strong momentum in tech stocks at the time. Despite the RSI flashing overbought, external factors kept pushing the price higher.
In strong trending markets, RSI can give misleading signals. Combining RSI with other technical tools or waiting for confirmation can help avoid acting on false signals.
Is it better to use RSI alone or as part of a broader CFD trading strategy?
While RSI is a powerful tool, it should not be used in isolation. Markets are complex, and no single indicator can provide a complete picture. The most successful traders combine RSI with other indicators, such as moving averages, Bollinger Bands, or volume analysis, to confirm signals and improve their chances of success.
For example, use RSI to identify potential entry points and a moving average to confirm the trend direction. By combining indicators, the accuracy of trades can be increased and reduce the likelihood of being caught by false signals.
How can I manage risk when using RSI in highly leveraged CFD trades?
Managing risk is critical when trading CFDs, especially with leverage. Here are some risk management tips when using RSI:
Set Stop-Loss Orders: Always use stop-loss orders to protect against unexpected market moves. For example, if buying based on an oversold RSI signal, place a stop-loss just below a recent support level.
Position Sizing: Keep position sizes manageable. Even with a high-confidence RSI signal, leverage can magnify losses if the trade goes in the wrong direction.
Avoid Overtrading: Don’t enter a trade based on every RSI signal. Instead, wait for confirmation and only trade when the setup meets predetermined criteria.
What are the best practices for setting RSI alerts in CFD trading platforms?
Setting RSI alerts on a trading platform is a great way to automate a trading process and avoid missing opportunities. Here are some best practices:
Overbought/Oversold Alerts: Set alerts when RSI crosses the 70 or 30 levels, signalling overbought or oversold conditions.
Divergence Alerts: Some platforms allow alerts to be set for RSI divergences, which can signal potential trend reversals.
Midline Alerts: Consider setting alerts when RSI crosses the 50-level, indicating a potential shift in trend momentum.
How can I customise RSI for different asset classes like forex, indices, or commodities in CFDs?
RSI can be customised based on the asset class being traded. Different markets behave differently, and adjusting RSI settings can help improve its effectiveness:
Forex: Forex markets often experience long trends, so a higher RSI period (e.g., 21 or 25) may be more effective in smoothing out volatility.
Indices: Stock indices tend to be less volatile than individual stocks, so a standard 14-period RSI is often effective for these markets.
Commodities: Commodities can be more volatile, so use a shorter period (e.g., 9 or 10) to capture quicker price movements.
The material provided here has not been prepared in accordance with legal requirements designed to promote the independence of investment research and as such is considered to be a marketing communication. Whilst it is not subject to any prohibition on dealing ahead of the dissemination of investment research we will not seek to take any advantage before providing it to our clients.
Pepperstone doesn’t represent that the material provided here is accurate, current or complete, and therefore shouldn’t be relied upon as such. The information, whether from a third party or not, isn’t to be considered as a recommendation; or an offer to buy or sell; or the solicitation of an offer to buy or sell any security, financial product or instrument; or to participate in any particular trading strategy. It does not take into account readers’ financial situation or investment objectives. We advise any readers of this content to seek their own advice. Without the approval of Pepperstone, reproduction or redistribution of this information isn’t permitted.