CFDs are complex instruments and come with a high risk of losing money rapidly due to leverage. 81.1% of retail investor accounts lose money when trading CFDs with this provider. You should consider whether you understand how CFDs work and whether you can afford to take the high risk of losing your money.
- English
- 简体中文
- 繁体中文
- ไทย
- Tiếng Việt
- Español
- Português
- لغة عربية
2 Charts which have caught my attention - Oil and Bitcoin
.jpg)
The black liquid has been making some interesting price moves, before we move to the chart some of the more pertinent fundamental data is as follows. Hurricane Ida is taking longer to resolve, with more than 39% of Gulf of Mexico production still offline according to the regulator Bureau of Safety and Environmental Enforcement (BSEE). Then more Hurricane news arrived with Nicholas Aside, however, the expectation is for Nicholas to peter out and transform into a tropical depression instead. Further on the supply side, China's offloading of its strategic crude reserves could pressure prices if ramped up.
Peering over at demand, we had the private US inventory data (official out tonight) out last night which showed a much larger than expected drawdown (-5.4mln vs -3.5mln). There is also media reports that the UK’s travel system will be seeing an overhaul which could lead to improved jet fuel demand.

(Source: TradingView - Past performance is not indicative of future performance)
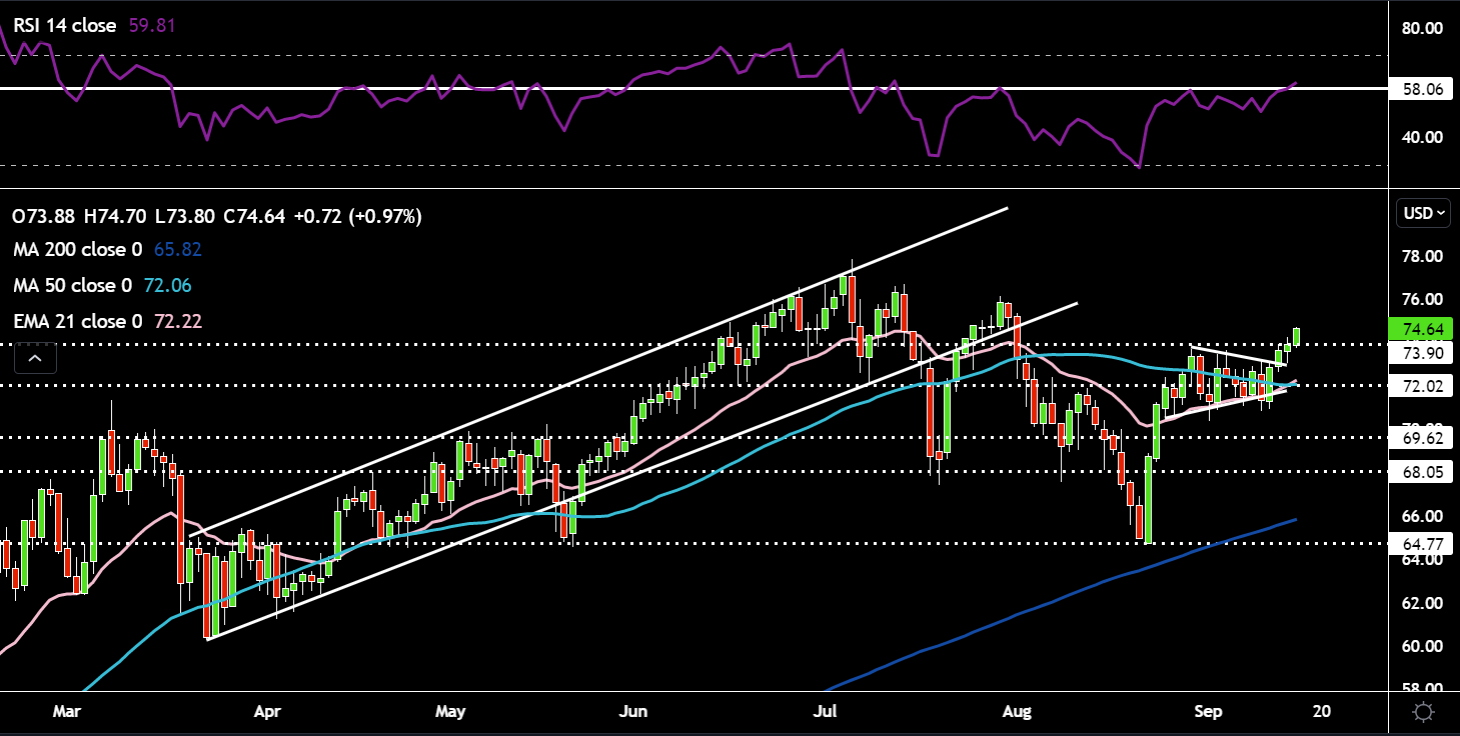
Oil has been on a tear over the past 4 days, breaking above the mini triangle pattern and eyeing the $75 level. The 21-day EMA has crossed above the 50-day SMA, which is positive for short term momentum. The RSI is very slightly above the 58 level (capped previous price rallies). Targets wise, first could be $75 then the 6 July high of $77.82. On the downside, $72 support and 50-day SMA could be pivotal. Below there $70 would be important

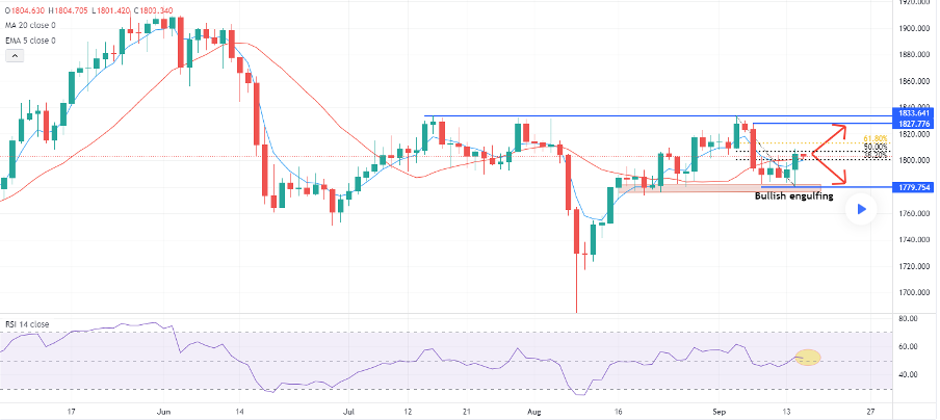
Bitcoin has made the famed Golden Cross, whereby the 50-day SMA crosses above the 200-day SMA. Client positioning data indicates clients are skewed just shy of 60% long on BTCUSD. The RSI is at a crucial level, 53, which was were price dips previously held and could act as resistance now. There is horizontal support around $44.5k which helping to find buying demand. For the bulls, price needs to break above $49.2k resistance then the $52.8k high on September 6 comes into play. If $44.5k were to break then $41k former range resistance would be a target, below there $38.1k support would be of interest.
Ready to trade the potential opportunity? Trade it with Pepperstone.
Related articles
Ready to trade?
It's quick and easy to get started. Apply in minutes with our simple application process.
The material provided here has not been prepared in accordance with legal requirements designed to promote the independence of investment research and as such is considered to be a marketing communication. Whilst it is not subject to any prohibition on dealing ahead of the dissemination of investment research we will not seek to take any advantage before providing it to our clients. Pepperstone doesn’t represent that the material provided here is accurate, current or complete, and therefore shouldn’t be relied upon as such. The information, whether from a third party or not, isn’t to be considered as a recommendation; or an offer to buy or sell; or the solicitation of an offer to buy or sell any security, financial product or instrument; or to participate in any particular trading strategy. It does not take into account readers’ financial situation or investment objectives. We advise any readers of this content to seek their own advice. Without the approval of Pepperstone, reproduction or redistribution of this information isn’t permitted.


