Los CFDs son instrumentos complejos y conllevan un alto riesgo de perder dinero rápidamente debido al apalancamiento. El 81.1% de las cuentas de inversores minoristas pierden dinero al operar CFDs con este proveedor. Debes considerar si comprendes cómo funcionan los CFDs y si puedes permitirte asumir el alto riesgo de perder tu dinero.
- Español
- English
- 简体中文
- 繁体中文
- Tiếng Việt
- ไทย
- Português
- لغة عربية

Headline nonfarm payrolls rose by +275k last month, considerably above the consensus for a rise of +200k, and only just inside the wide forecast range of +110k to +285k. Despite this, some shine was taken off the headline payrolls beat by a chunky -167k net revision to the prior 2 months of data, though the 3-month average of job gains did tick higher to +265k, the highest level since last June.
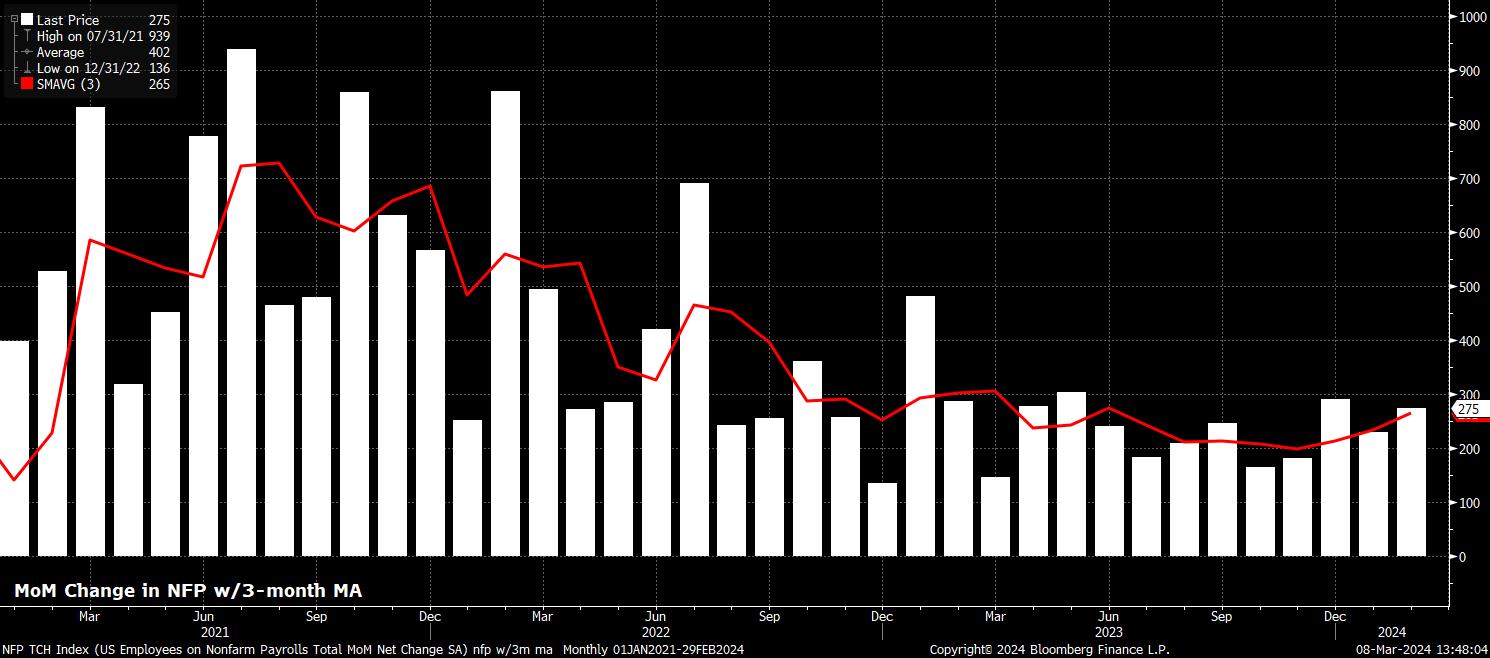
The headline payrolls beat was somewhat more surprising given the downside risks that had been flagged by leading indicators in advance of the data. The employment components of both the ISM manufacturing and services surveys printed below the 50 mark last month, while both initial and continuing jobless claims continued to rise, and Challenger job cuts notched their biggest February rise since 2009.
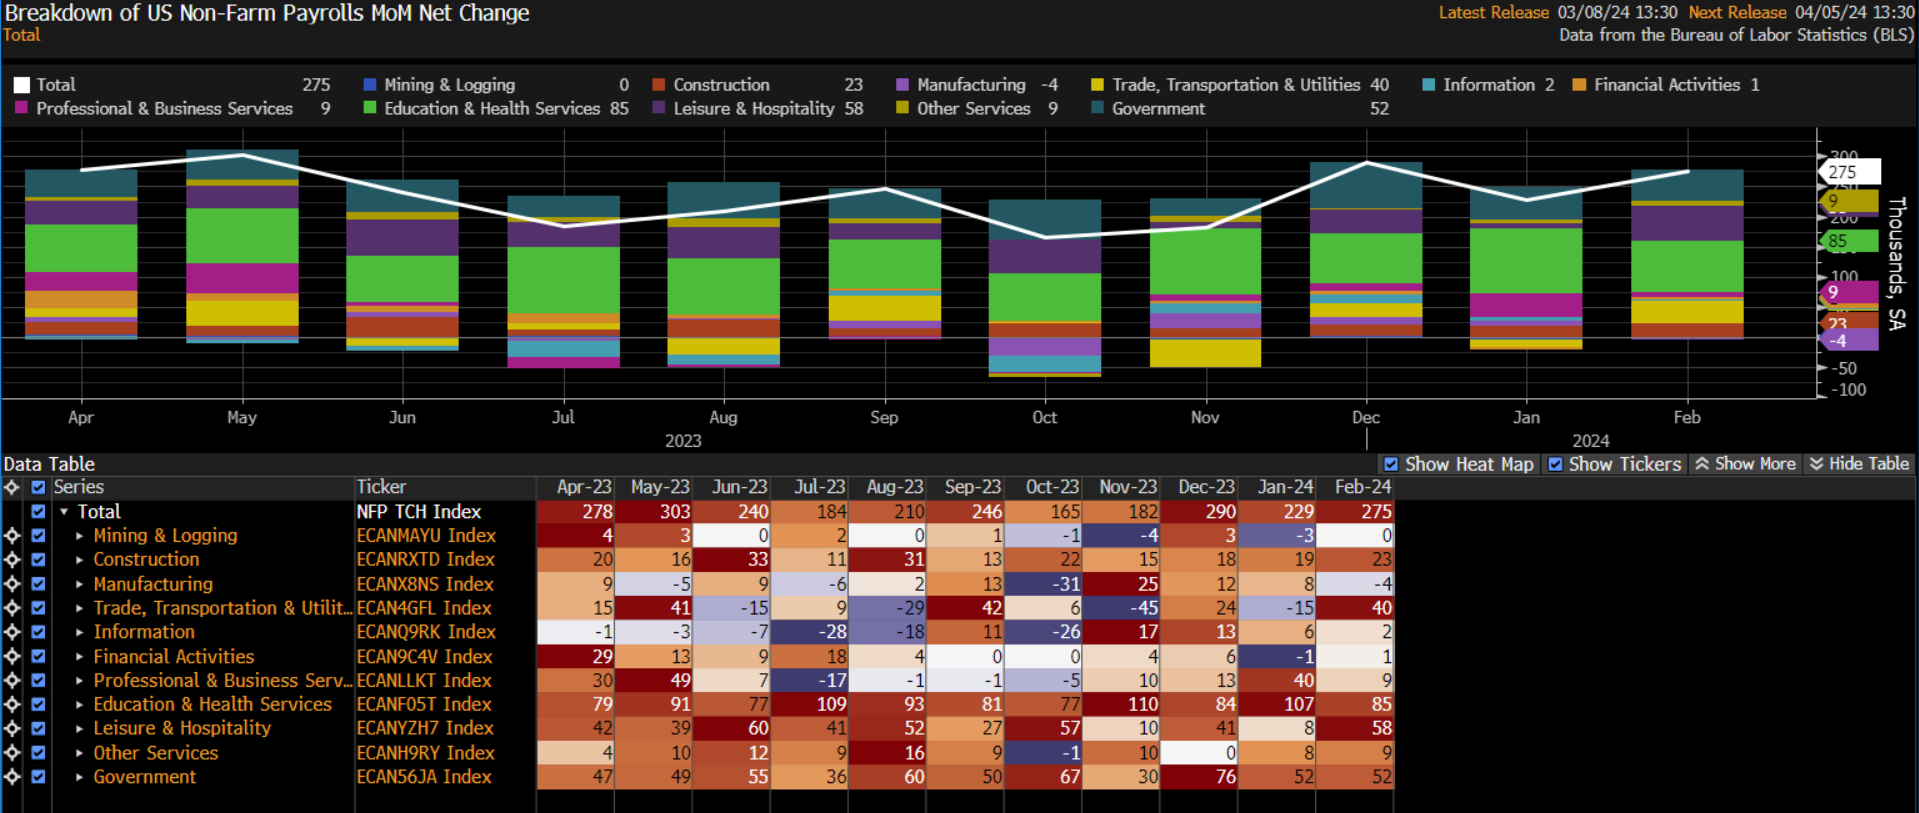
In terms of sectors, job gains were again broad-based across the economy, with only the manufacturing sector notching a modest -4k fall in employment, while jobs stagnated in mining and logging. Every other sector displayed an MoM job gain, with education & healthcare, as well as leisure & hospitality, comprising the bulk of the monthly rise in nonfarm employment.
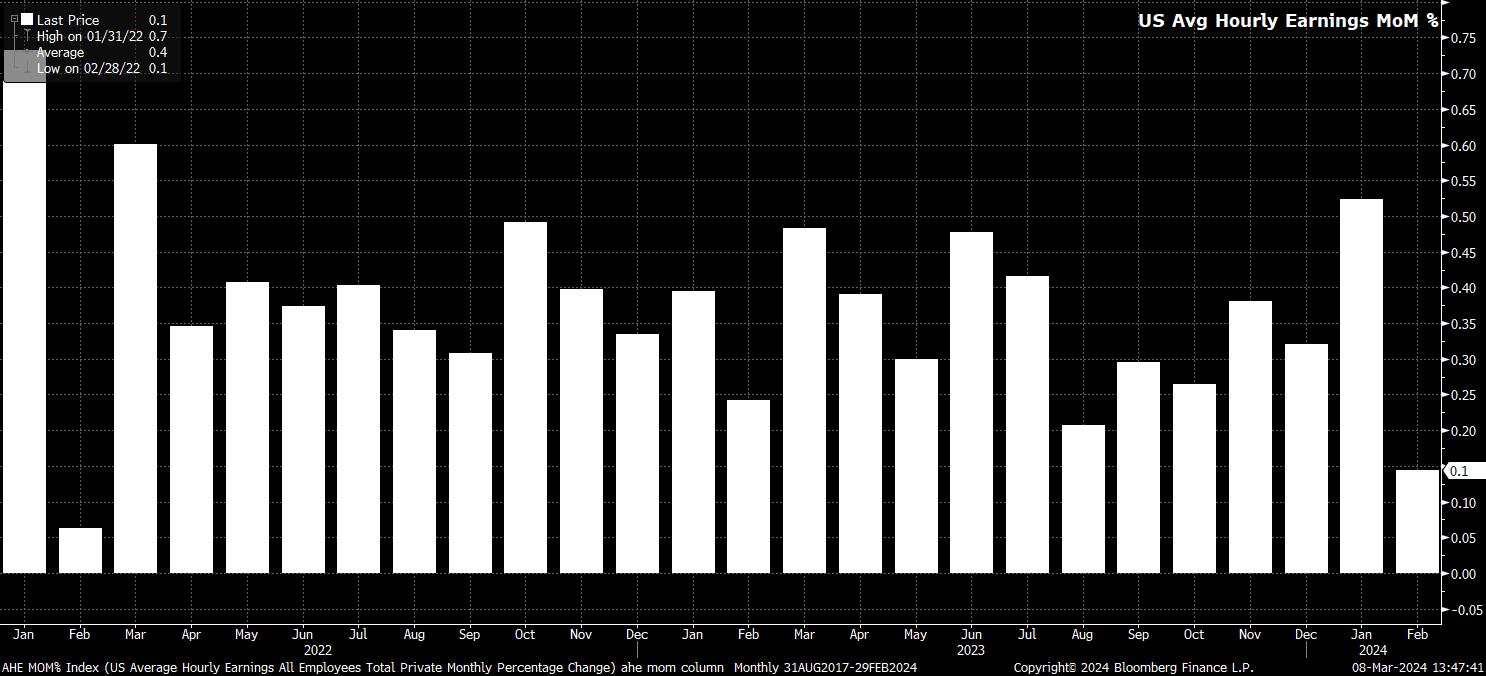
Sticking with the establishment survey, data showed average hourly earnings rose a cool 0.1% MoM in February, a drop from the 0.6% MoM pace seen in January, which was the fastest monthly rise since March 2022. Earnings growth also cooled on an annual basis, with the YoY rate dipping to 4.3% from 4.5% in January.
While this cooling is likely to please some of the hawks on the FOMC, and potentially allay some concerns over sticky services inflation, it should be recognised that, as with a fall in workweek hours pushing AHE higher in January, a rise in the hours worked measure, to 34.3 last month, would’ve exerted some downward pressure on the earnings print.
Meanwhile, turning to the household survey, the labour market picture becomes substantially less rosy.
Headline unemployment unexpectedly rose to 3.9% last month, compared to consensus expectations for a fourth straight print at 3.7%, the highest rate since the start of 2022. As always, one must view the unemployment rate in conjunction with other measures of labour market slack. These measures painted a similarly soft picture, with underemployment unexpectedly ticking higher to 7.3%, while participation held at the disappointing 62.5% level seen in the weather-affected month of January.

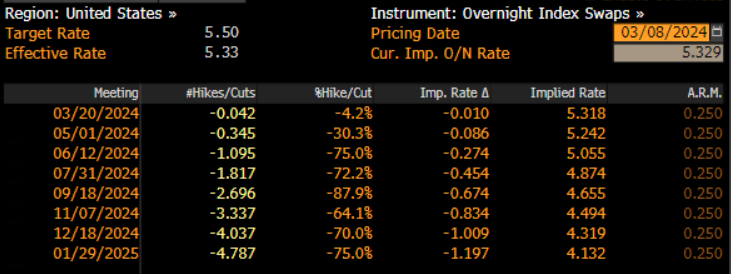
The relatively cool household survey, in addition to the sharp downward revision to the January and December figures, caused a modest dovish reassessment of Fed policy expectations. While markets continue to see the Fed kicking off the easing cycle with a 25bp cut in June, USD OIS now implies around 100bp of easing over 2024 as a whole, up from around 92bp pre-NFP.
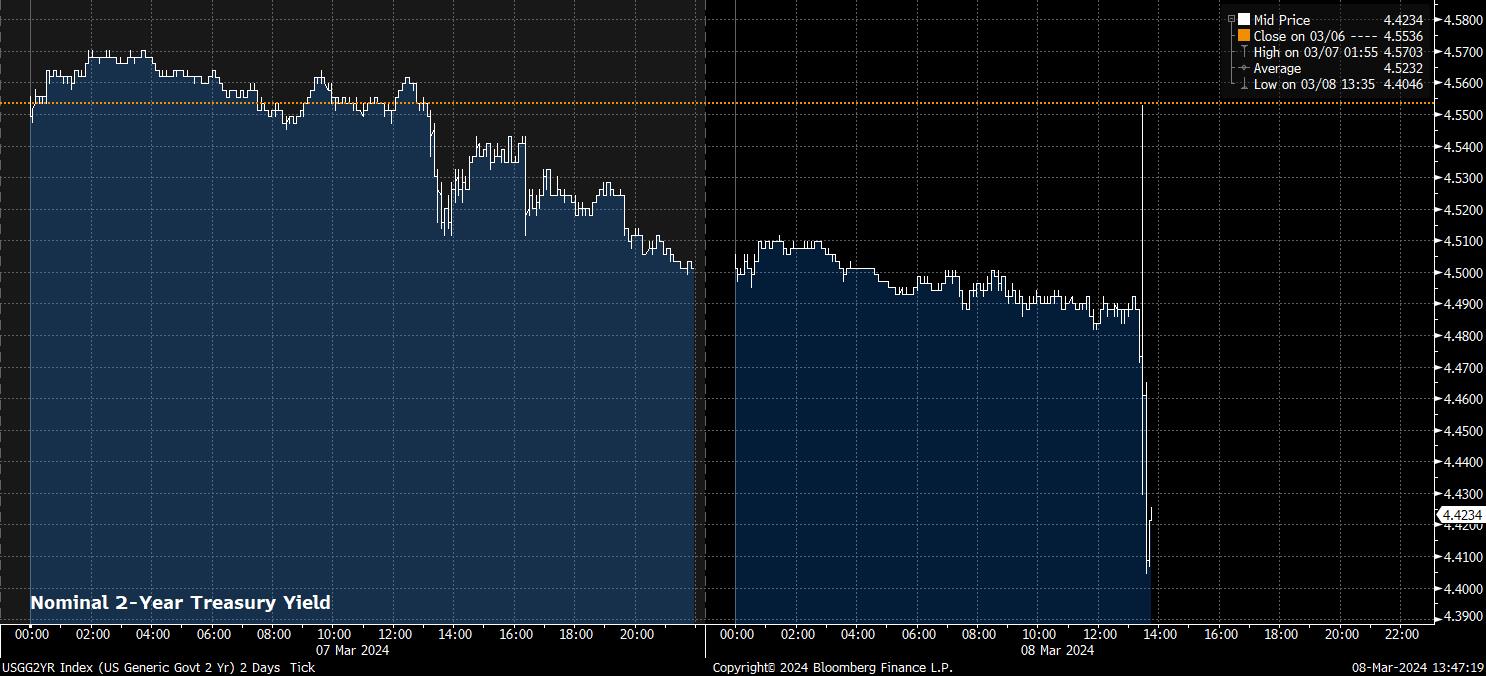
Unsurprisingly, this move in the OIS curve caused a modest dovish reaction across markets, led particularly by the front-end of the Treasury curve, with 2s rallying around 10bp in the aftermath of the jobs report, as the curve on the whole bull steepened.
The rally across the Treasury curve allowed equities to pop to session highs, while the dollar slipped to fresh session lows, with cable rallying further north of 1.2850 to fresh highs since last August, as the EUR rallied towards a test of the 1.10 handle, and the JPY extended BoJ-sources driven gains to test 146.50 to the downside.
Gold also received a fillip from the decline in yields, with the yellow metal extending earlier gains to over 1% on the day, touching fresh all-time highs in the spot market. Equities also popped to fresh session highs, with the path of least resistance here continuing to point to the upside.
In sum, while February’s headline payrolls print may have, again, smashed expectations, a surprising rise in unemployment, and substantial downward net revision to the prior two months of data take some of the shine off the release. While it is far too early to call this a worrying trend, it is becoming increasingly clear that the jobs market is beginning to cool at a more rapid pace, providing further confidence of a return to 2% inflation, and solidifying expectations that the Fed will deliver the first 25bp cut in June.
Naturally, focus now turns to next week’s US CPI print, as the game of second-guessing policy expectations rolls on.