Five common trading mistakes and how to avoid them
Simple and subtle guidelines can allow aspiring traders to progress up the learning curve and become consistent in a relatively short period of time.
Most traders fail to respect these basic, yet essential rules:
- Follow the trend.
- Sit on your hands until there is a trend to follow.
- Cut losses as soon as logically possible.
- Let winners run as long as logically possible.
- Know Your Indicator (KYI).
In this article, we shall review the basics using some examples, to convey how these guidelines keep traders out of trouble.
Follow the trend
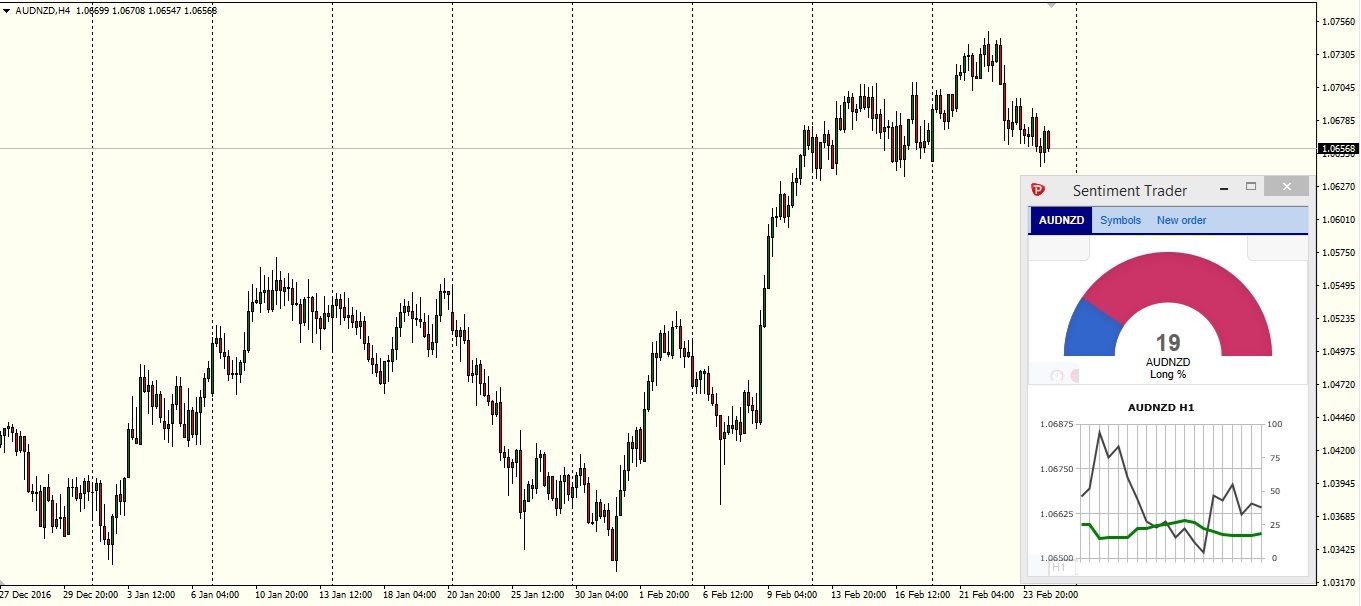
"AUDNZD 4H chart - Pepperstone MT4 with Sentiment Trader (Smart Trader Tools)"
Most retail traders have trouble following trends. More often than not, when a trend is developing, retail traders are fighting it, attempting to pick tops and bottoms. It’s a repetitive habit that Pepperstone’s Sentiment Trader illustrates in a systematic way.
- When there is a defined (evident) uptrend, retail sentiment will be short as retail traders attempt to fade the rally
- When there is a defined (evident) downtrend, retail sentiment will be long as retail traders attempt to “catch falling knives”.
The chart above is a good example. For the whole month of February 2017, AUDNZD has been steadily rising. For four weeks in a row, AUDNZD has made higher highs and higher lows. And yet, what does Sentiment Trader show us? Only 19% of retail traders are long, hence 81% of retail traders are fighting this trend!
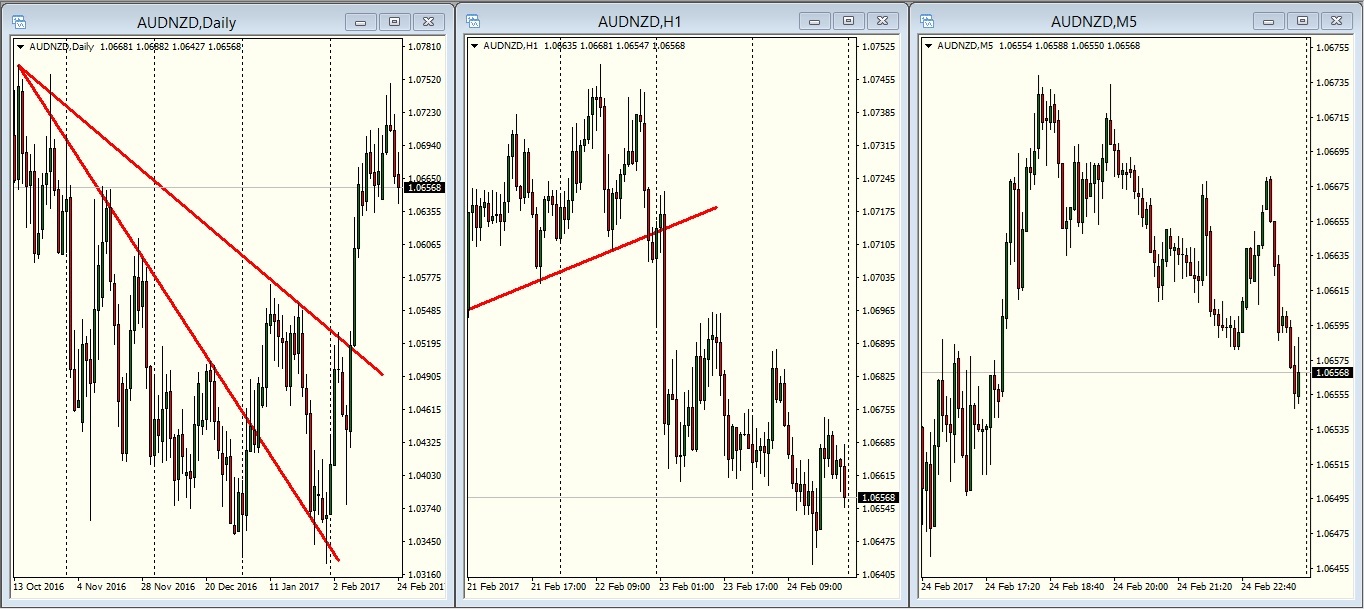
"AUDNZD daily, 1h, 5min charts - Pepperstone MT4"
Evidently, many traders have trouble identifying a trend. And that is understandable: depending on how a trader looks at his charts, multiple trends can coexist within the same currency pair at one time!
It’s rare to see currency trending in the same direction on all time frames. It does happen, when momentum is strong or driven by news, but the ebb and flow of the market tends to confuse traders that use multiple time frames.
For example, in the chart above, AUDNZD seems to be trending upwards on the daily time frame, but appears to be trending downwards on the 1h time frame and is largely range bound on the 5min time frame.
When trading from the retail angle, keeping things simple is generally best, so here are three suggestions for identifying a trend:
- Stick to one time frame (usually the daily) for trend identification. The smaller time frames can be used to “zoom-in” for better entry and stop placement, but the trend needs to be identified from one primary time-frame consistently.
- Use Pepperstone’s Sentiment Trader and wait until the “crowd” is structurally on the wrong side of a move. When Sentiment Trader starts showing readings below 40% (in an uptrend) or above 60% (in a downtrend), most likely a stable trend has emerged and traders must only look for entries in line with the trend.
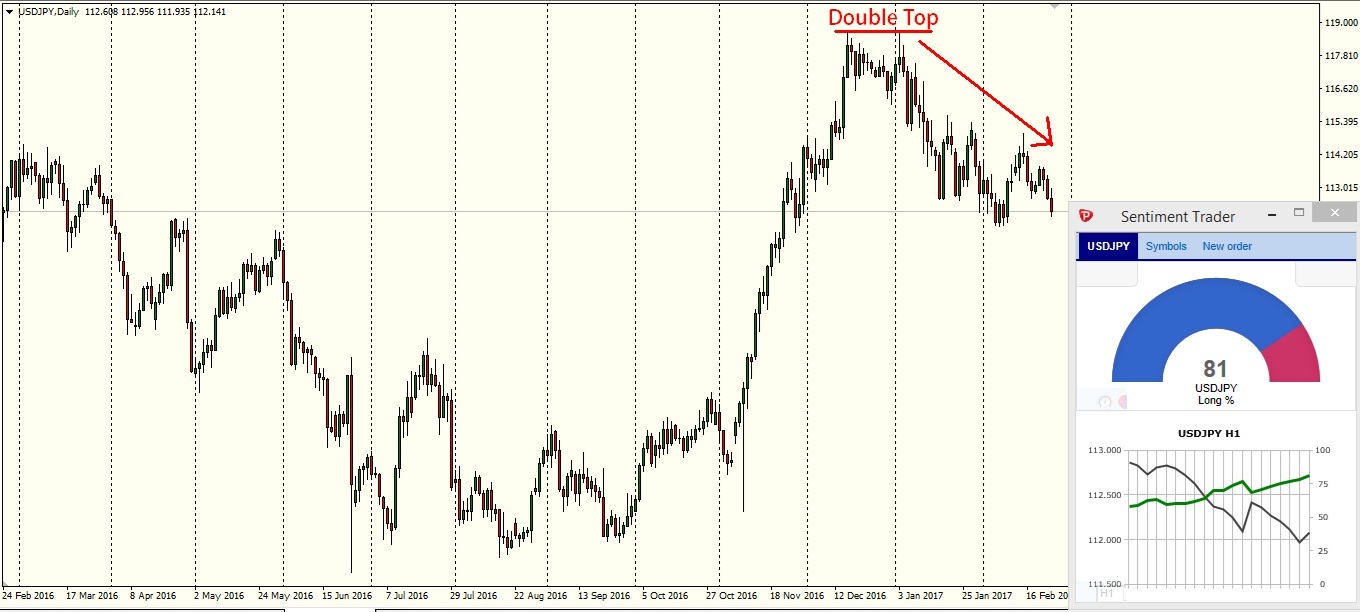
"USDJPY daily chart - Pepperstone MT4 with Sentiment Trader"
- Follow the net non-commercial direction from the Commitment of Traders report. Non-commercial entities are nothing other than large speculative accounts that follow longer term trends.
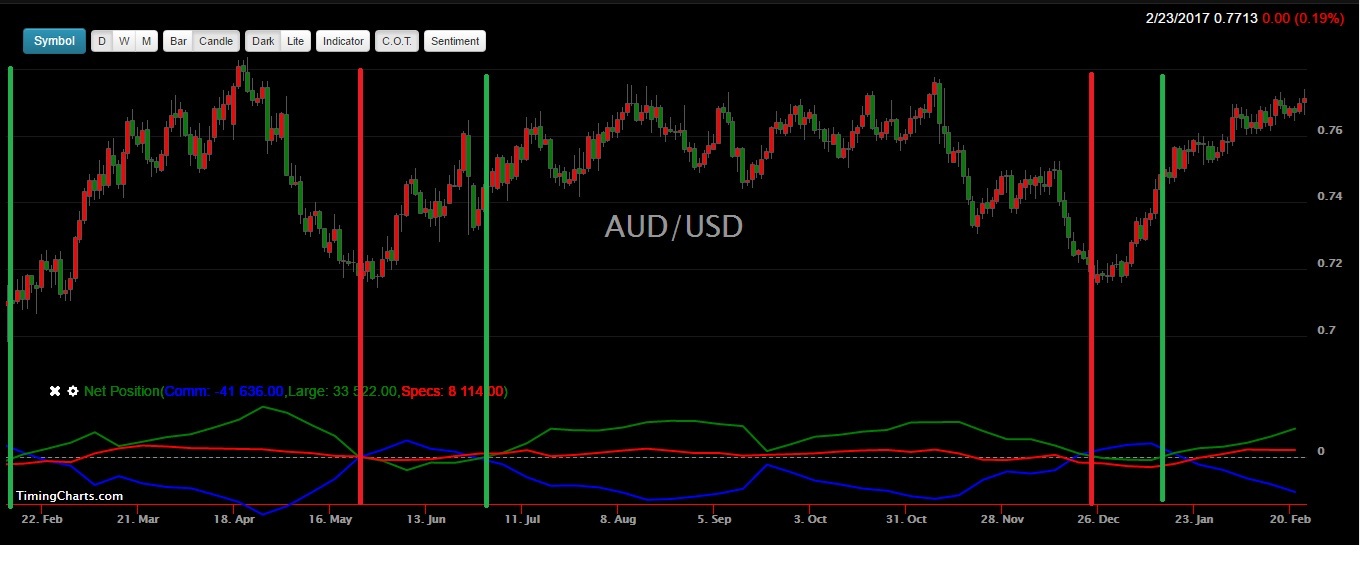
"Source: Timingcharts.com"
The AUDUSD chart with Commitment of Traders net positioning above shows the net non-commercial position in green. The vertical lines represent non-commercial traders flipping net long (green) or net short (red).
Following the non-commercial entities is once again a non-discretional way of identifying a trend. However, there are some drawbacks to using the COT report alone.
- It’s only applicable to the FX Majors.
- It comes out on a Friday evening with data relative to the prior Tuesday.
Fortunately, there is a way around these limitations. The non-commercial entities are very technical in their trend identification and can be reasonably divided into three time frames.
- 13 weeks or 65 Days (approximately one business quarter).
- 26 weeks or 120 Days (approximately half a year).
- 52 weeks or 240 Days (approximately one year).
- By overlaying these moving averages on a daily chart, you can always understand approximately what the non-commercials are doing.
Sit on your hands until there is a trend to follow
The second key guideline, which is connected to trend trading, is to “sit on your hands” and refrain from trading, unless/until there is a clear trend in place.
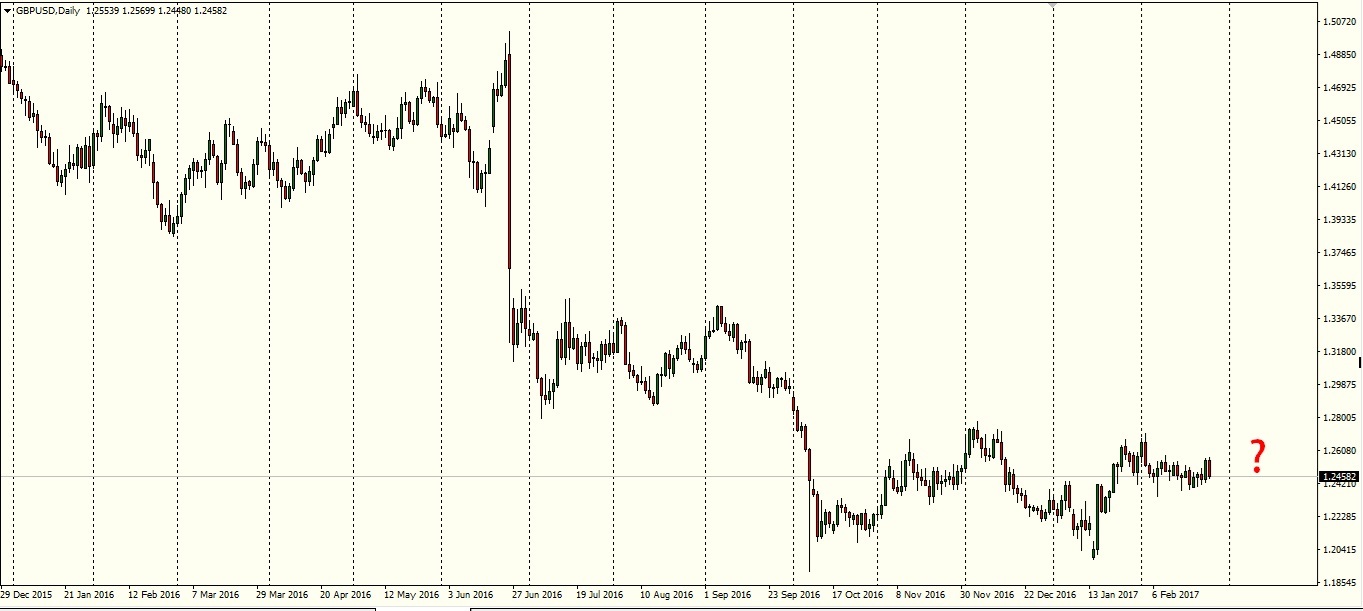
"GBPUSD Daily Chart - Pepperstone MT4"
In the chart above, Cable is clearly not trending at the moment. So, what is the best stance? If you replied “remain as flat as a pancake”, you are correct. Without a clear trend, there is no edge for trend trading.
Of course, there are various alternative ways to trade that do not rely solely on trends as an edge. However, retail traders often have part-time or full-time jobs, which reduce the amount of screen time they have at their disposal. Furthermore, the time constraint reduces the amount of pre-trade analysis that can be done before pulling the trigger.
The bottom line is that retail traders are better off being light on their feet. Keep the analysis method simple, and keep the trigger criteria equally simple.
Trend trading fits the bill because it only takes a few minutes each day to filter the quality trends in the market at any given time.
Cut losses as soon as logically possible and ride winners
Have you ever held onto a losing trade, thinking that the market “had” to turn around sooner or later? This is a direct violation of the one rule that we simply cannot ignore: cut losses quickly. In the same way, we should be looking to hold onto our winning trades as long as logically possible.
The process of monitoring your trade after the initial entry is called “trade management”. Trade management is an area that is not covered in detail within classic trading books. It’s all about entries and exits. But how do we formulate a plan that helps us cut losses as soon as logically possible, but not sooner? And how can we know when to hold?
The basic idea is to let the market dictate when it’s OK to hold, and when it’s time to fold. Simple tools that can help with managing trades successfully are:
- Peak/trough analysis
- Price behaviour
- Common sense
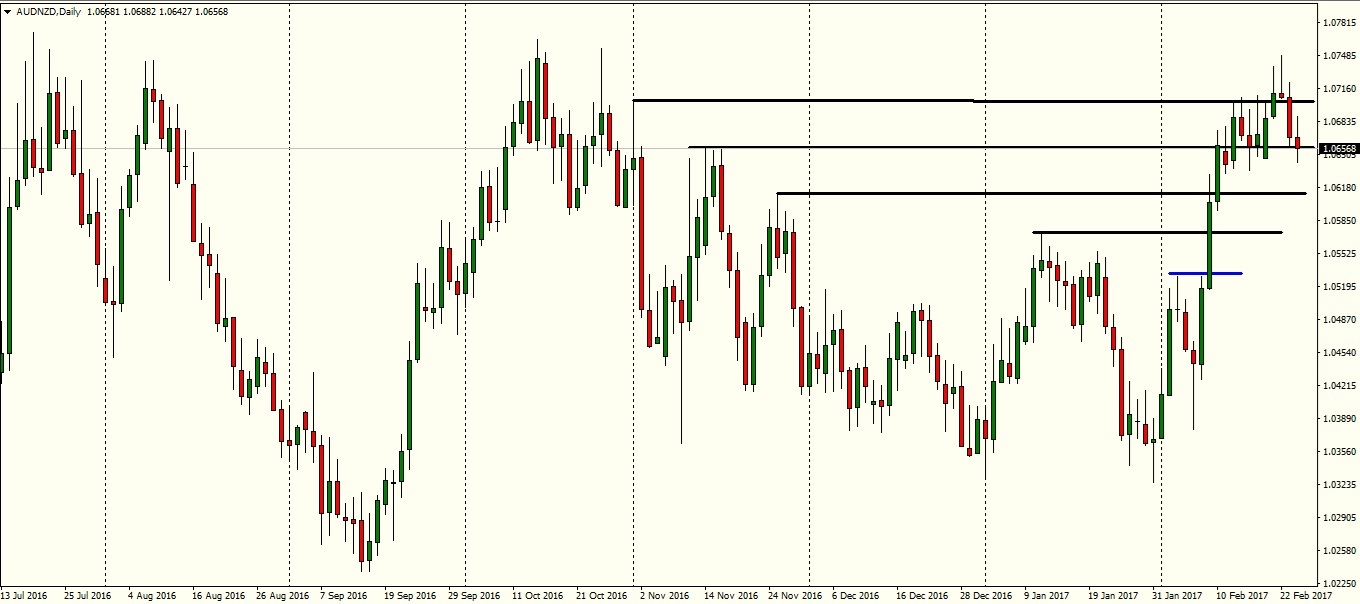
"AUDNZD daily chart - Pepperstone MT4"
In the chart above, we have hypothesised a breakout entry (blue line) and we have highlighted potential resistance points above entry. For the ill-prepared trader, these resistance points are “reasons to exit the trade”. But is there a better way?
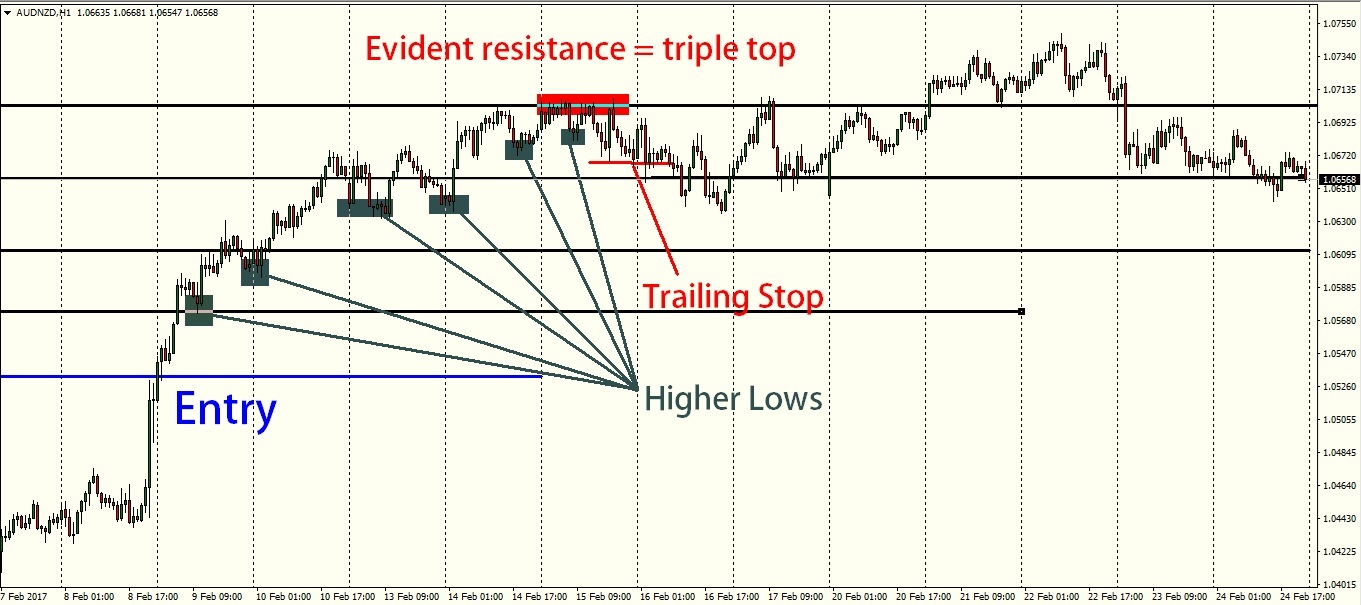
"AUDNZD 1H chart - Pepperstone MT4"
In the chart above, we used simple peak/trough analysis, alongside prior swing levels from the daily chart, to assist with our trade management. As long as price continues to print higher lows on the shorter-term time-frame (in line with our daily bias), we keep the trade live. When we see decisive resistance (Triple Top) at a key level, we observe the lows and trail our stop aggressively.
Without a consistent structure for managing your trades, it will be a struggle to keep your emotions at bay and “trade what you see”.
Know Your Indicator (KYI)
The charts in this article so far have not shown any indicators apart from support and resistance lines. But some traders prefer to overlay technical indicators on their chart, to assist with decision-making.
That’s fine, but too many traders fall into the trap of “covering” their charts with technical indicators, without knowing:
- What the indicators actually indicate.
- How the indicators are built.
Unfortunately, without knowing this, it’s impossible to properly use any indicator and know when the indicator might be giving false signals. Technical indicators are tools. Without a good understanding of what exactly your “tool” does, you won’t know when or how to use it.
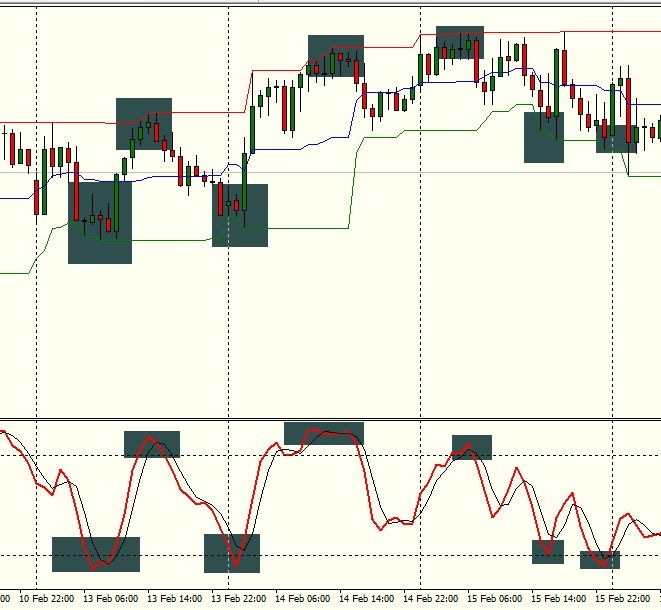
In the chart above, we have inserted a stochastic indicator (14,3,3) and a 14-period Donchian channel. Many traders attribute more importance to indicators than they deserve. We would like to prove this point below.
A stochastic oscillator only says “where is price now, compared to the lookback period”. In our example, we have a 14-period lookback, so we are only creating a percentile read of the position of price, compared to the range of the past 14 candles.
To calculate the stochastic oscillator, first decide on the number of periods (%K periods) to be included in the calculation. In our example, we used 14 periods, but it can change depending on your personal preferences.
Then calculate %K, by comparing the latest closing price to the range traded over the selected period:
CL = Close [current candle] - Lowest Low [in lookback Period]
HL = Highest High [in lookback Period] - Lowest Low [in lookback Period]
%K = CL / HL *100
Calculate %D by smoothing %K. The original formula used a 3 period simple moving average, but this can be varied, based on the time frame that you are analysing.
That’s it! That’s all a stochastic oscillator does. It does not give you any more information than you can receive with your own eyes. To make this point even clearer, observe the Donchian channel.
A Donchian channel simply tracks the highest high and the lowest low of the lookback period (14 periods in our example). It’s no surprise that overbought/oversold readings on the stochastic are accompanied by “touches” of the Donchian channel. Simply stated, both indicators are telling us when we’re moving outside the range designated by the lookback period!
If you choose to use indicators, make sure you know them inside out. What are they helping you “see”? What is their strength and what is their weakness?
By learning your indicators inside out, you’ll gain much more insight than by simply overlaying them on the chart and “trusting them blindly”.
Over to you
In this article, we have revisited five common trading mistakes, and offered some easy solutions to fix them. Trading from the retail angle requires clarity of mind, so it pays dividends to keep the analysis process simple and subtle.
By keeping your charts clean, following evident trends, and sitting on hands when there are no trends; by cutting losses quickly and letting profits run; and by knowing exactly why you’re using certain indicators; you can keep your trading logical and gain peace of mind when making decisions in the markets.
All this makes for disciplined and consistent trading, as opposed to emotional trading or simply “gambling”, which does much harm to trading accounts.